

- Imaging Techniques and Radiological Anatomy of the Upper Urinary TractSapna Singh, Jyoti Kumar, Anjali Prakash
- Current Status of Nuclear Medicine in Urinary Tract ImagingRakesh Kumar, Madhavi Tripathi
- Renal Calculus Disease and Obstructive UropathyUma Debi, Mahesh Prakash, Mandeep Kang
- Renal Parenchymal DiseaseSreedhara BC, Anupam Lal, Anindita Sinha
- Nontubercular Infections of the Urinary TractUjjwal Gorsi, Naveen Kalra, Ajay Kumar
- Tubercular Infection of the Urinary TractAshu Seith Bhalla, Priyanka Naranje, Arun Kumar Gupta
- Renal Cystic DiseasesJyoti Kumar, Anjali Prakash, Sapna Singh
- Renal NeoplasmsAnjali Prakash, Gaurav Shanker Pradhan, Rashmi Dixit
- Renovascular HypertensionSanjeev Kumar, Vineeta Ojha, Sanjiv Sharma
- Imaging of Renal Transplant
ANATOMY OF THE UPPER URINARY TRACT
The upper urinary tract consists of paired kidneys and the ureters. The kidneys develop from three structures—the pronephros, the mesonephric, and metanephric ducts in that order. The pronephros regresses by 4th to 8th week of gestation leaving no adult correlate while the mesonephric duct forms the male genital structures. The ureteric bud and the metanephric blastema arise from the metanephric duct in the 5th week of gestation. The metanephric blastema develops into Bowman's capsule, the convoluted tubules, and loop of Henle while the ureteric bud develops into ureter, the renal pelvis, calyces, and the collecting ducts. The calyces arise due to repeated divisions of the upper end of the ureteric bud and this forms the basis of the lobar structure of the kidney, each lobe consisting of a calyx and the associated collecting ducts and renal cortex. The lobar outline becomes smooth by around 5 years of age owing to multiplication of the renal cortical cells. However, in about 5% of the individuals, there is persistence of the lobar outline into adulthood.
It is during the 4th to 8th week of gestation that the kidneys migrate cranially from the pelvic region where they develop. The cranial migration is due to the lengthening of the lumbar and sacral spine during development so that the normal final position of the kidneys is upper lumbar region. They also rotate medially by around 90° so that the renal pelvis lies on the anteromedial aspect of the kidneys.1 The lateral sacral branches of the aorta supply the pelvic kidneys but during ascent they acquire higher lateral branches of the aorta. The definitive renal arteries are seen at the first lumbar disc (L1-L2) level. If the inferior arteries do not regress, accessory renal arteries can be seen. Accessory unilateral renal arteries are seen in 30% population and bilateral are seen in 10% with a higher frequency seen with anomalies of ascent.2
The kidneys come to lie in the retroperitoneal space with the right kidney lower in position than the left owing to the presence of the liver on the right. The normal kidneys should be 12–14 cm in length and the difference between the two should not be more than 1 cm. In quiet respiration, the kidneys move up and down 2–3 cm and much more in deep inspiration. The renal hilum is a vertical opening on the medial aspect which contains the renal pelvis and renal vessels. The renal veins lie anterior to the renal arteries which in-turn lie anterior to the renal pelves. In addition, the hilum also contains fat, nerve fibers, and lymphatic channels which drain into the lateral aortic lymph nodal group.
Each kidney is divided into an outer renal cortex and an inner renal medulla.3 The medulla consists of 8–16 renal pyramids (Fig. 1).


4Each renal pyramid in-turn contains the ascending and descending limbs of the loop of Henle and the collecting ducts. The cortex contains the glomerulus and the proximal and distal convoluted tubules. The apex of the renal pyramid projects into a calyx at the renal papilla. The renal collecting system consists of 10–14 concave-shaped minor calyces. The lateral extensions of the calyces is called the forniceal angle. Two to four minor calyces join together to form the superior, middle, and inferior major calyces respectively from superior to inferior. The minor calyces drain into the major calyx by a narrow neck/infundibulum. The major calyces in-turn drain into the renal pelvis which continues as the ureter at the pelviureteric junction (PUJ).
Variants of the Calyceal Anatomy
- Compound calyx: Here, the multiple single calyces fail to divide and form a single large calyx known as the compound calyx. Here, several renal papillae which represent the apices of the renal pyramids drain into a single calyx. Compound calyces are usually seen at the polar region, i.e. at the upper or lower poles and are prone to reflux nephropathy.
- Complex renal calyces and megacalycosis: In megacalycosis, there is a greater number of calyces than normal (>15). There is dilatation of some or all renal calyces with normal renal pelvis and ureter. Renal calyces may have a blunted morphology, but this condition should not be confused with papillary necrosis in which the number of calyces is not increased and necrosis tends to be dissimilar from calyx to calyx.
- Calyceal diverticulum: It represents a focal extrinsic dilatation of a renal calyx. A calyceal diverticulum connects to the calyceal fornix and projects into the cortex rather than the medulla.
Retroperitoneal Spaces
The kidneys have a tough fibrous capsule closely applied to the renal cortex all around except at the hilum.
The kidneys are retroperitoneal organs and lie in a space called the perinephric space or the perineal space. The perinephric space is a space bound by layers of fascia and is an important determinant of the direction of disease spread. The fascia anterior to the kidneys is called the Gerota's fascia while the posterior fascia is called the fascia of Zuckerkandl. The space enclosed between the anterior and posterior fascia is called the perinephric space (Fig. 2). In addition to the kidneys, the space contains the adrenal gland, the upper ureter and the perinephric fat. As the kidneys ascend from the pelvis to the abdomen, the perinephric fascia forms a cone with its apex pointing superiorly, the apex being closed.3,4
The transversalis fascia lines the inferior aspect of the diaphragm, the inside of the abdominopelvic cavity, anterolateral abdominal wall, the anterior aspect of the spinal column, the psoas and paraspinal muscles, and the superior aspect of the pelvic diaphragm. There is a potential space between the posterior perinephric fascia and the adjacent transversalis fascia. This space is called the posterior pararenal space and contains only fat (Fig. 2). The posterior pararenal space is of interest to the radiologist as a guidewire may kink in this area or a drain intended for the pelvicalyceal system may be accidently positioned here. The anterior pararenal space, on the other hand, is the space between the anterior perinephric fascia and posterior layer of the peritoneum. In the center of the anterior pararenal space lie the pancreas and duodenum, the ascending colon lies to the right and descending colon to the left. These organs are hence in direct contact with the anterior perinephric fascia.4

5Laterally, the anterior and posterior perirenal fascia fuse with the lateroconal fascia at the fascial trifurcation. While the posterior pararenal space is continuous laterally with the lateral extraperitoneal space (the properitoneal line) lying between the parietal peritoneum and transversalis fascia, this space is closed medially. Medially, the posterior perinephric fascia fuses with the transversalis fascia over the paraspinal muscles, that is the psoas muscle and the quadratus lumborum. The posterior perinephric space hence lies directly over the psoas muscle being separated only by the transversalis fascia. Thus, any inflammation process of the kidneys can spread rapidly into the psoas muscles and from there into the iliacus muscle, iliopsoas, and the pelvis.
Thus, superiorly the renal fascia fuses with the diaphragmatic fascia. Laterally, the renal fascia fuses with the lateroconal fascia and inferiorly with the iliac fascia blending loosely with the periureteric connective tissue. Owing to the loose blending of the fascia, the inferomedial angle adjacent to the ureter is the weakest point of the perinephric compartment through which urine or perinephric effusion escapes most easily. The posterior renal fascia fuses with the psoas and quadratus lumborum fascia medially.
The perineal spaces also communicate with each other across the midline and with the retroperitoneal vascular space. The pararenal spaces communicate caudally and with the extraperitoneal spaces including the prevesical space. Infections from one space can hence spread to the other subsequently. The anterior interfascial or the retromesenteric space and the posterior interfascial or retrorenal space are potential spaces within the laminated anterior perinephric and posterior perinephric fasciae, respectively (see Fig. 2).5 The perirenal space contains thin septations called the Kumin's septa. These septae may arise from the renal capsule and extend to the anterior and posterior renal fascia. Some may arise from the renal capsule and run parallel to the renal surface. The renorenal bridging septum is the most consistent which arises from the posterior renal capsule and runs parallel to the posterior surface of the kidney. These septae thicken consequent to a disease process, what is referred to as perinephric stranding. These fibrous septae act as potential conduits between the perinephric and interfascial spaces. Fluid and collections may track from any of these potential spaces to the other and also via the fascial trifurcation into the lateroconal fascia.
Relations of the Kidneys
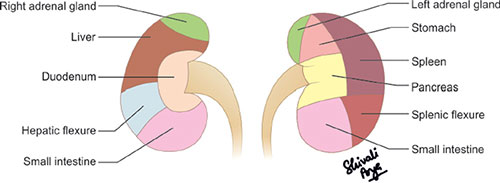
The right kidney is related anteriorly with the inferior surface of the liver and the second part of the duodenum while the anterior relations of the left kidney are the pancreatic tail, the spleen, the stomach, the small bowel, the splenic flexure, and the left colon (Fig. 3).4 Posteriorly, the diaphragm, psoas muscle, aponeurosis of the transverses abdominis muscle, and the lumbar muscles are related to the kidneys. Both the kidneys are related superiorly with the adrenal glands while inferiorly the hepatorenal pouch/Morrison's pouch separates the right kidney from the inferior surface of the liver.
Vascular Anatomy
The renal arteries arise from the aorta, slightly below the origin of the superior mesenteric artery (SMA). The right renal artery (RRA) arises from the anterolateral aspect of the aorta and then passes posterior to the inferior vena cava (IVC) as it courses toward the right renal hilum. The left renal artery (LRA) arises from the lateral or posterolateral aspect of the aorta and follows a posterolateral course to the left renal hilum.
6Accessory renal arteries may arise from the aorta in as many as 20% individuals, either superior or inferior to the main renal artery. The renal arteries typically divide into anterior and posterior divisions that lie anterior and posterior to the renal pelvis, respectively. These divisions give rise to the segmental arteries which branch further within the renal sinus, forming interlobar arteries that penetrate the renal parenchyma. These terminate in arcuate arteries that curve around the corticomedullary junction giving rise to cortical branches.3,4
Each renal vein is formed from tributaries that coalesce in the renal hilum. The left renal vein passes anterior to the aorta and posterior to SMA, to enter the left side of IVC. The right renal vein, which is shorter, extends directly to the IVC from the right renal hilum.
The lymphatic drainage is to the lateral aortic lymph nodes around the origin of the renal arteries.
Ureters
The ureter runs down the anterior aspect of the psoas muscle, the transversalis fascia separating the two. The ureters run within 1 cm of the lateral margin of the vertebral transverse processes. At the level of the sacroiliac joint, it crosses over the anterior aspect of the bifurcation of the common iliac artery as it enters the pelvis. It then runs along the lateral pelvic wall just medial to the obturator internus muscle. At the level of the ischial spine, it runs anteromedially until it enters the superolateral angle of the bladder base. In males, the vas deferens crosses over the ureter just before it enters the bladder wall. The ureters run obliquely for around 2 cm through the bladder wall.4
The ureters have three normal constrictions which act as points of temporary peristaltic arrest which are as follows:
- At the ureteropelvic junction
- Crossing the iliac vessels
- At the pelvic inlet.
IMAGING TECHNIQUES OF THE UPPER URINARY TRACT
CONVENTIONAL RADIOGRAPHY
The conventional plain radiography of the abdomen is an imaging technique for the kidneys ureter and bladder also known as the kidney, ureter, and bladder (KUB) film.6 The kidneys are visible on the plain radiograph due to natural contrast provided by the perirenal fat. An idea about the renal shape, margins, dimensions, and localization can be made on the plain radiograph. It can also be used to identify renal calculi, calcifications or transparencies due to fat or gas.7 The psoas shadow can also be seen on the plain radiograph. Radiopacities seen on the plain radiographs correspond to the renal stones or calcifications due to tuberculosis, vascular structures or traumatic lesions like hematoma (Figs. 4A and B).

Figs. 4A and B: (A) Plain X-ray of kidney, ureter, and bladder (KUB) showing a large radiodensity in the left renal area suggestive of a left renal calculus; (B) Another plain film showing multiple radiopacities in the left renal area suggestive of multiple renal calculi.
|
Calcifications seen in solid or cystic neoplasms may also be seen on plain radiograph (Table 1). The radiolucencies correspond to gas, e.g. emphysematous pyelonephritis or fat, i.e. large angiomyolipoma (AML) or liposarcoma.
INTRAVENOUS UROGRAPHY
Intravenous urography (IVU), also known as the excretory urogram is a time-tested technique of uroradiology providing a global view of the renal parenchyma and collecting system.8
Indications:
- Urolithiasis
- Ureteric fistulae/strictures
- Renal infections, e.g. tuberculosis. IVU still remains the gold standard in the imaging of renal tuberculosis. It is the only modality that can detect early changes in the renal calyces in tuberculosis, e.g. early fuzziness, irregularity of calyces, papillary necrosis, etc.
- Persistent or frank hematuria.
Normal Physiology Giving Rise to the Appearances on IVU
Intravenous urography consists of a series of plain films following intravenous injection of water soluble iodinated contrast medium.9 The contrast reaches the renal arteries 12–20 seconds following contrast injection. The concentration of the contrast material is maximum in the vascular compartment at this stage, but it begins to fall rapidly as it enters the extracellular compartment. It also undergoes glomerular filtration and enters the renal tubules. Hence, in the first minute following contrast injection, there is a diffuse enhancement referred to as the nephrogram phase provided the kidneys are healthy with the patient having a normal cardiovascular system. The renal size and outline are best evaluated in the nephrogram phase, the normal renal length being at least three lumbar vertebrae and not exceeding four. Contrast then begins to appear in the calyces around 1 minute which subsequently drains into the pelvis and ureter referred to as the pyelogram phase. The normal ureters demonstrate continued peristalsis and it may not be possible to visualize the entire length of both (or even one) ureters in a single film. In most cases, partial visualization of the ureters is acceptable.
Technique
Traditionally, patients were deprived of fluid before an IVU examination with the belief that it would lead to a better opacification of the collecting system. However, it has long been established that dehydration is associated with an increased risk of nephrotoxicity and should be completely avoided. In fact, if the patient is dehydrated before the IVU, it needs to be corrected first. Food should be avoided 4–6 hours prior to the examination and bowel preparation (using laxatives) is preferable to avoid gases overlying the renal shadows. The patient is called fasting (4–6 hours) and with adequate bowel preparation but should be well hydrated. A plain radiograph (KUB) is must as it gives an idea of the bowel preparation and is needed to follow up a previously proven calculus. A preliminary KUB also gives an idea of exposure factors, correct positioning/centering, and any obvious pathology, most common of which is urinary tract calcification.
Blood urea and serum creatinine levels should be checked before contrast administration as the risk of contrast-induced nephropathy is increased if serum creatinine is greater than 1.5 mg/dL. Also, in patients with impaired renal function (serum creatinine greater than 3.5 mg/dL), the excretion of the contrast material and subsequent renal and ureteric visualization are limited.
If the patient is fit to undergo the examination, contrast is injected at the dose of 1 mg/kg body weight. The standard dose is usually 50 mL of 350–370 mg l/mL water soluble iodinated contrast medium. Although usually safe there is a small risk of reactions.10 The most severe reaction that can occur following contrast administration is anaphylactoid type hypersensitivity reaction. Hence, before injection of contrast medium, a history of allergy to any previous contrast exposure should be elicited.11 The injection should be administered through an indwelling cannula that can be kept in place for the entire duration of the investigation. This would allow any emergency treatment to be given in case of an eventuality. Also, in cases of poor 8contrast opacification, a further dose of contrast medium can be administered. Most contrast reactions take place within the first few minutes following contrast injection. Emergency drugs, oxygen, and resuscitation should be available in the IVU room. The radiologist should be available in the X-ray room for the entire duration of the procedure.
Sequence of films taken
5-minute film |
|
15-minute compression film |
|

Abdominal compression is applied after the 5-minute film to improve the distention of the pelvicalyceal system by inhibiting ureteric drainage. However, compression should not be applied in children, in patients of hypertension/aortic aneurysm, those with recent abdominal surgery or abdominal pain or tenderness. After 15-minute film with compression, the compression is removed and full length films are taken in the supine and prone positions, the prone position allowing a better visualization of the pelvic ureters (Figs. 5A to C).
At times, a delayed film needs to be taken in cases of significant acute obstruction where there is a delay in the opacification of the pelvicalyceal system. This follow-up IVU needs to be done till a time when the contralateral kidney has completely excreted the contrast.
With the advent of cross-sectional imaging, the utility of IVU is a topic of considerable debate.12 Computed tomography (CT) scores over IVU for urolithiasis with a sensitivity of 100% versus 52–69% for IVU.13 In one review, patient acceptability, superior diagnostic performance of CT versus IVU, equivalent radiation doses using low-dose techniques in CT were the factors for recommending CT over IVU.14 CT is also superior to IVU for urinary tract tumor detection with sensitivities of only 21%, 52%, and 85% for masses less than 2, 2–3, and greater than 3 cm, respectively on IVU.15 However, a blanket substitution of IVU by cross-sectional imaging is not feasible due to cost and availability factors.
DIGITAL TOMOSYNTHESIS
Digital tomosynthesis (DT) is a technique that enables visualization of stones from multiple angles rather than simply anterior to posterior. The technique involves acquisition of images at regular intervals at different angles during a single linear or arc sweep of the X-ray tube. The images can then be reconstructed providing better resolution than conventional radiography.

Figs. 5A to C: (A) Plain X-ray of kidney, ureter, and bladder (KUB) showing multiple left renal calculi and radiodensity in the line of the right ureter suggestive of left ureteric calculus; (B and C) Intravenous urography images showing renal calculi as filling defects within the opacified left pelvicalyceal system and the right ureteric calculus. Note is made of the upper ureter being dilated and tortuous with a characteristic medial angulation suggestive of retrocaval ureter.
9Compared with CT, DT offers a reduced radiation exposure, higher in plane resolution, easier availability, and lower cost. In a study done to evaluate the accuracy of IVU using DT, a significant improvement was seen from 46.5% for conventional IVU to 95.5% for IVU with DT.16 There was a dose reduction of 56% and a decrease in the length of the procedure.16 This technique may be useful in situations such as evaluation of residual stone after percutaneous lithotripsy, that is, in situations where a detailed imaging of the renal parenchyma is not required. DT is currently an experimental technique and may play a role in KUB radiography remaining an important technique in kidney stone imaging in the future.
RETROGRADE PYELOGRAPHY
Retrograde pyelography (RGP) involves opacification of the pelvicalyceal system retrogradely by instillation of contrast medium into a ureteric catheter placed by cystoscopy. With the advent of multidetector computed tomography (MDCT) with isotropic data acquisition and multiplanar reconstruction, the role of RGP is limited.17
The indications include:
- As a problem-solving tool in cases of persistent diagnostic uncertainty, especially if there is hematuria and/or suspicious cytology.18
- To confirm or negate the presence of one or more filling defects within the collecting system.
- To demonstrate the lower end of an obstructed ureter.
Technique
Catheters are positioned within one or both ureters cystoscopically by the urologist. Under fluoroscopic screening, 5–20 mL of water-soluble iodinated contrast medium is injected via the catheter. Care should be taken so as to not inject air bubbles as these can be mistaken for filling defects. The ureters and pelvicalyceal system are hence opacified retrogradely. These should be opacified adequately but not overdistended as a forceful and excessive contrast injection can lead to reflux of contrast into the collecting ducts (pyelotubular reflux), contrast extravasation into the renal sinus (pyelosinus reflux), forniceal rupture, and even into the regional lymphatics or veins (pyelolymphatic and pyelovenous reflux).
ANTEGRADE PYELOGRAPHY
It is a simple invasive procedure used to evaluate the cause and level of ureteric obstruction where other imaging modalities have failed to do so. The technique involves positioning the patient 45° semiprone and puncturing the pelvicalyceal system with a fine (22 gauge) needle under fluoroscopy or ultrasound guidance. The puncture should be directed through the renal parenchyma into a suitable calyx and then into the pelvis.4 Aspiration of urine can confirm the cannulation. Water-soluble contrast medium is then injected to opacify the pelvicalyceal system. A series of spot films of the ureter down to the level of obstruction can be taken.
NEPHROSTOGRAM
A nephrostomy tube is usually positioned for therapeutic purposes but contrast can be instilled through it and a nephrostogram can be performed. It is indicated to assess the continued presence of calculus or any obstructing lesion or determine the cause of obstruction if it has not been demonstrated. Nephrostogram is also done in post-operative patients of PUJ obstruction to check the patency.4 It is used to monitor the status of fistulas. Spot films of the ureter are taken down to the level of obstruction.
GRAYSCALE ULTRASOUND
Ultrasound is a reliable technique for the evaluation of upper urinary tract. It is noninvasive, easily available, accurate, safe, and does not require exposure to ionizing radiation. It can be performed bedside for sick patients and interventions can be performed under ultrasound guidance.
Indications for sonography in upper urinary tract:19
- Diagnosing dilatation of the collecting system and to search for renal obstruction.
- Excellent modality for evaluation of cystic renal lesions. Their architecture including internal septations, wall thickening, calcifications, presence or absence of solid components (in order to assign a Bosniak grade) can all be evaluated on ultrasound.
- Postnatal ultrasound for the evaluation of urinary tract in documented prenatal fetal hydronephrosis.
- Characterization of renal masses.
- Detection of nephrolithiasis and resultant back pressure changes, if any.
- Guidance for therapeutic and interventional procedures.
Technique
Positioning and Access
A 3–5 MHz curvilinear/linear transducer is used to scan the kidneys and ureter. A supine or lateral decubitus position can be adopted for kidneys. The right kidney is usually examined first where the liver is used as an acoustic window (Figs. 6A and B). The transducer is placed in subcostal or intercostal position. Owing to gases from the small bowel and splenic flexure visualization of the left kidney becomes difficult at times via anterior or anterolateral approach. In such situations, a posterolateral approach can be adopted for the left kidney with the left side of the patient raised by approximately 45°.23 The spleen provides an acoustic window on the left side. If even after raising left side of the body by 45°, visualization is not successful, a full right lateral decubitus with the pillow under the right flank and the left arm extended over the head may allow visualization of the left kidney. Prone position is usually adopted for young children for adequate visualization of the kidneys. A prone position is useful in adults in ultrasound-guided procedures.24
Renal Size
The longest craniocaudal length should be measured by rotating the probe around its vertical axis. The longest length should be measured as false low measurements are obtained at times due to ellipsoidal shape of the kidney. Renal length which gives an estimate of the overall renal size is quick and easy to measure. The determination of renal size with ultrasound is more accurate than with IVU because the kidney is imaged without magnification and contrast-induced osmotic diuresis. As a result renal size is approximately 15% smaller. Renal size is related to sex, age, and built of the patient. The length of the normal adult kidney is usually 10–12 cm but can range from 7 cm to 14 cm in patients with normal renal function (Table 2). Length can also vary in the same individual depending on the state of hydration.
Where an absolute accurate estimate of the size of the kidneys is necessary, the renal volume can be measured. This can be achieved by measuring the area of the kidney in serial slices and calculating the volume but this method is very time consuming. A modified three-dimensional (3D) ellipsoidal formula is utilized where the length, anteroposterior diameter, and transverse diameters are multiplied by a constant which is approximately 0.5.19 Volume measurements are done in postnephrectomy, patients to look for compensatory hypertrophy and in the assessment of renal transplants.
Emamian et al. measured the renal size in 665 healthy adult volunteers and showed that the parenchymal volume of the right kidney is smaller than the left.26
|

Figs. 6A and B: (A) Longitudinal and (B) transverse views of the kidney on ultrasound showing bright central sinus echoes, the cortex, and the hypoechoic medulla.
11Possible explanation for this could be: (1) The spleen is smaller than the liver and so there is more space for left kidney growth and (2) The LRA is shorter than the right and, therefore, increased blood flow on the left results in an increase in renal volume.
Cortical and Parenchymal Thickness
The cortical thickness is the distance between the renal capsule and outer margin of the renal pyramids while parenchymal thickness is the distance between renal capsule and margin of the sinus echoes (Fig. 7).
Perirenal Structures
An assessment of the perirenal fat, pararenal areas, and adrenal areas should be done. At times, in case of any renal abnormality, liver, pancreas, lining of ureters, pelvis, and bladder may need to be examined.
An important point while examining the kidneys on sonography is to take care that the whole length of the kidney is included otherwise peripheral abnormalities may be missed. When longitudinal examination is complete, turning the transducer through 90° ensures that kidney is examined in transverse plane from top to bottom. In addition to the size and shape of kidney, its cortical reflectivity as compared to the liver and spleen, the degree of corticomedullary differentiation and the appearance of medullary pyramids should be taken into account.
Normal Appearances on Ultrasound
Identification of kidneys on sonography is easy owing to the difference in reflectivity between parenchyma and surrounding fat. The outer cortical margin is well-defined due to the renal capsule, but the renal parenchyma adjacent to the renal sinus echo is less well-defined. The reflectivity of the kidneys can be compared with that of the liver and spleen on the right and left side, respectively. The renal cortex has a lower reflectivity than the adjacent liver and spleen. This difference in reflectivity may vary as it is dependent on the equipment to some extent and may be less obvious with some makes or scanners or pre- and postprocessing settings. However, if the renal cortex has a higher reflectivity, that is, it is brighter than the adjacent visceral organs, it is highly suggestive of renal parenchymal disease.27 The medullary pyramids are seen as echo-poor oval structures evenly distributed around the inner margins of the cortical parenchyma (Fig. 8). The pyramids are less reflective as compared to the cortex. The well-defined margin between the pyramids and the adjacent cortex is responsible for the corticomedullary differentiation which gets lost in the presence of generalized parenchymal inflammation and edema.

Fig. 7: Ultrasound image showing the normal cortical thickness (++) measured from the renal capsule to the outer margin of the medullary pyramids and the parenchymal thickness (xx) from the capsule to the margin of the sinus. The parenchymal thickness is more than the cortical thickness.
The renal sinus contains the calyces, infundibulum, a portion of the renal pelvis, fibrous tissue, fat, vessels, and lymphatics. On ultrasound, the renal sinus appears as a central hyperechoic area, largely because of its fat content.28 When collapsed, the collecting system merges with the echoes of the renal sinus. However, in well-hydrated patients, it may be slightly distended with echo- free urine.
The neonatal kidney is sonographically more echogenic than that of the older infant and adults (Figs. 9A and B).29 Echogenicity is equal to or greater than the adjacent liver.

Fig. 8: Ultrasound scan of the kidney showing the corticomedullary differentiation well with the medulla seen as echopoor oval areas evenly distributed around the inner margin of the cortex. Arcuate vessels seen as echogenic foci mark the corticomedullary junction.

Figs. 9A and B: Ultrasound images showing the normal neonatal kidney. The cortex is thin and highly reflective while the medulla is large out of proportion and very poorly reflective. The renal sinus is also echopoor.
It assumes the adult appearance by 2–3 months of age. Other differences are tabulated in Table 3.
Normal Variations
The kidneys may vary in position due to ptosis or an ectopic location. The most common site for the ectopic kidney is the pelvis, where it may be difficult to detect, as it can be obscured by bowel gas. Renal duplication is common and spans a range from complete to minimal. However, sonography may only show an elongated kidney perhaps with separation of the renal sinus into two parts. A double pelvis may be visualized when the collecting system is distended. Residual fetal lobulations may be seen. A dromedary hump can be seen sometimes which is a bulge along the lateral border of the left kidney due to molding by the adjacent spleen.
A hypertrophied column of Bertin is a normal variant and represents unresorbed polar parenchyma from one or both of the two subkidneys that fuse to form the normal kidney. Sonographic criteria to diagnose a hypertrophied column of Bertin include isoechogenicity and continuity with rest of the renal cortex, lack of mass effect, indentation of renal sinus laterally, generally less than 3 cm in size with a normal vascular pattern on Doppler.32 Occasionally, it may be difficult to differentiate a small avascular tumor from a hypertrophied column of Bertin when further investigations may be required. A wedge-shaped echogenic defect or an echogenic line, the intervesicular fissure or parenchymal junctional defect, may sometimes be seen running obliquely from the sinus to the capsule in upper anterior or lower posterior part of the kidney.33 It was thought to represent connective tissue at the junction of the development of anterior and posterior components of the kidney. However, subsequent reassessment suggests that this line represents an extension into the parenchyma of hilar/sinus fat in patients with a deep renal sinus, rather than a true plane of fusion between embryological components. It may mimic a scar or rarely a small echogenic tumor.34
The renal sinus thickness is normally equal to the parenchymal thickness. However, it may vary depending on the fat content of the sinus. An increase in fat content of the renal sinus can occur in obese individuals, in renal sinus lipomatosis, and in cases of parenchymal atrophy. It is decreased in neonates and in cachectic patients.
A mild distension of the collecting system can occur due to physiological filling. This can be seen in a fluid-loaded subject, a patient on diuretics, diabetics, recovery phase of acute tubular necrosis (ATN), single kidney, neonatal kidney, and patients with an overdistended bladder.
|
DOPPLER EVALUATION
Indications
- Renovascular hypertension
- Differentiation between obstructive and non-obstructive hydronephrosis
- Evaluation of transplant kidney
- Renal vein thrombosis
- Miscellaneous, e.g. trauma, arteriovenous malformation (AVM), etc.
Technique
With the patient supine, the RRA can be identified arising approximately 1 cm below the origin of the SMA. Occasionally, LRA can be identified at its origin from the posterolateral or lateral surface of aorta. Both renal veins and their junction with the IVC can usually be demonstrated in this plane. In slim patients, it is occasionally possible to follow the renal artery and vein into the hilum of the kidney.35 The right and left posterior oblique positions can also be used to identify the vessels in the midline. Throughout the course of examination of renal vessels, color Doppler is frequently switched on to confirm the nature and direction of flow (Fig. 10). The optimum pulse repetition frequency is selected to detect moderate flow velocities, although it may need to be modified to detect high velocities if a stenosis with aliasing of color signals is present.36 With the system set to detect low or moderate flow velocities, flow can be identified in almost all patients in the vessels at the renal hilum. Angling of the probe medially from the right or left flank will allow assessment of the intrarenal vessels. Though the hilar and interlobar vessels are demonstrated in all patients, the arcuate and striate arteries may be seen only in slimmer patients. Power Doppler can show smaller vessels with slow flow, though with loss of directional information (Fig. 11). Contrast-enhanced ultrasound (CEUS) can further enhance visualization of parenchymal vessels.

Fig. 10: Normal renal spectral pattern on color Doppler showing steep systolic peak and a good diastolic end flow.
Normal Doppler Pattern
There is a rapid systolic upstroke, which is occasionally followed by a secondary slower rise to peak systole. Subsequently, there is a gradual diastolic decay but with persistent forward flow in diastole. Spectral indices are measured in the renal artery at proximal, middle, and at the hilum. Normal range of values is shown in Table 4.36 Further, indices should also be measured in the intrarenal vessels at the superior, middle, and inferior pole of the kidney. The resistive index (RI) and pulsatility index (PI) values measured in healthy subjects show a significant dependence on age and the area sampled. The values in the main artery are higher than in the more distal smaller arteries and they are lowest in the interlobular arteries.
The renal vein spectra are often different for right and left veins. The RRV is short and often mirrors the pulsatility of the IVC, while the left, particularly if it is sampled to the left of the SMA, may show only slight variability of flow velocities.
Ureters on Ultrasound
The ureter is a long (25 cm) mucosal lined tube varying in diameter from 2 mm to 8 mm. The normal ureters are usually difficult to visualize as they are thin and collapsed structures. However, dilated ureters can be imaged in their proximal and distal parts. The proximal ureters are best visualized in a coronal oblique view, using the kidney as a window.
14

|
An attempt can be made to follow the ureter up to the bladder using the same approach. The distal ureters can be seen suprapubically through the full bladder.
CONTRAST-ENHANCED ULTRASOUND
Contrast-enhanced ultrasound is an emerging technology for evaluation of the genitourinary system with no known nephrotoxicity. It has a role in the characterization of indeterminate renal lesions, especially among those with chronic kidney disease (CKD). Iodinated contrast medium should be completely withheld in patients with later stages of CKD [glomerular filtration rate (GFR) <30 mL/min]. Similarly, gadolinium-based contrast agents should not be administered in severe renal insufficiency owing to the risk of nephrogenic systemic fibrosis (NSF). CEUS is safe in that it causes no nephrotoxicity. Microbubbles used in CEUS consist of a high molecular weight gas core surrounded by a lipid or albumin shell. The microbubbles are not excreted or secreted in the urinary tract but are exhaled out via the lungs and hence have no adverse effect on the kidneys. According to the 2011 European Federation for the Society of Ultrasound in Medicine and Biology Guidelines, the use of CEUS for renal indications include:37
- Characterization of indeterminate lesions when conventional ultrasound is equivocal
- Renal infarcts and cortical necrosis
- Abscesses
- Determination of surgical strategy for complex cystic masses
- Follow-up imaging of nonsurgical complex masses
- Tumor ablation under ultrasound guidance.
SonoVue, Optison, and Sonazoid are some of the ultrasound contrast agents available in the US for intravenous use while SonoVue is available in India. CEUS has shown promising results and its sensitivity has been reported comparable to that of contrast-enhanced CT in the characterization of renal lesions.38 The sensitivity in detection of renal malignancy has been found to be about 90% in several studies with a moderate specificity of 79–90%.39 An exciting new frontier in CEUS research is the use of targeted microbubbles where antibodies can be tagged to the outer shell. The antibodies get adhered to their molecular target and on imaging this is seen as persistence of enhancement. This is helpful in the detection of diseases and holds the prospect of delivering therapy specifically at these locations reducing the systemic toxic effects of the chemotherapeutic drugs.
ULTRASOUND ELASTOGRAPHY
Elastography can be used to diagnose kidney diseases and provides a more accurate estimate of the functional impairment than blood tests or kidney dimensions. Intrarenal fibrosis is a final common pathway for all chronic kidney diseases and it has been seen that the degree of fibrosis correlates with the severity of the disease. Renal biopsy can determine the degree of fibrosis and hence the severity of the renal parenchymal disease but it is invasive, is subject to sampling errors and samples a small fraction of the renal parenchyma leading to an inaccurate assessment.
Shear wave elastography (SWE) is an emerging technique which permits a noninvasive measurement of tissue stiffness. SWE uses focused acoustic energy pulses to produce shear waves which travel perpendicular to the tissue. As they progress through the tissue, they can be tracked sonographically. Stiffer the tissue, more is the shear wave velocity. Higher values of shear wave velocity thus correlate with higher degrees of renal fibrosis. Studies have shown that SWE is a low cost way to provide diagnostic information in patients with CKD and a correlation has been found between SWE, estimated renal stiffness, and renal fibrosis severity.40 Hence, SWE-derived estimates of tissue stiffness may serve as a noninvasive biomarker of healthy and diseased renal parenchyma in the near future.
COMPUTED TOMOGRAPHY OF THE UPPER URINARY TRACT
The cross-sectional imaging modalities such as CT and magnetic resonance imaging (MRI) allow a noninvasive visualization and a better understanding of the genitourinary tract. The anatomical characteristics of the renal and perirenal regions can be visualized objectively and accurately. Perfusion characteristics of the kidney can also be studied. CT plays a vital role in evaluating patients with renal cystic diseases, renal tumors, infections, and flank pain. Lesions containing fat or calcium are best assessed on CT.
MDCT allows volumetric data acquisition and submillimeter excellent quality images can 15be reconstructed in any plane. MDCT with its 3D postprocessing capabilities is highly accurate in the evaluation of renal masses and a noninvasive evaluation of vascular pedicle by CT angiography. MDCT reduces the diagnosis of indeterminate masses by enabling an improved characterization of renal masses, thus allowing a better therapeutic management. The faster scanning times, improved spatial and temporal resolution, and greater volume coverage with the MDCT scanners allow detection and characterization of small renal masses, display of vasculature similar to conventional angiography, and improved visualization of the collecting system and ureters with better demonstration of both intraluminal and extraluminal pathology.41,42 MDCT allows images to be obtained in different phases of enhancement of the renal parenchyma including the excretory phase (EP) and images simulating excretory urography can be obtained.43 Excellent quality multiplanar reformation (MPR) images and 3D rendering of any plane is possible owing to increased temporal resolution and acquisition of thin slices with isotropic voxels.44
Normal Appearance of the Upper Urinary Tract on CT
On the axial sections, the kidneys appear smooth and oval. The vascular pedicle enters the renal hilum which is seen as an anteromedial break (Fig. 12). The vascular pedicle lies anterior to the renal pelvis. Differentiation between renal artery and vein may not be possible on conventional scans. The renal veins are larger than the renal artery. Of the veins, the left renal vein is larger than the right owing to the aorta and SMA pinching the left renal vein.
The ureters are best visualized after intravenous administration of iodinated contrast material. The ureters are anterior to the common iliac artery, lateral to the external iliac artery, and anteromedial to the psoas major at the level of the sacral promontory. The ureters then reach the midportion of the internal obturator muscle coursing medially and posteriorly to the external iliac arteries. They then course anteromedially to reach the trigone of the urinary bladder (Figs. 13A to D).
Examination Technique and Imaging Protocols of MDCT of Kidney
A multiphasic CT is the preferred imaging technique in the evaluation of the upper urinary tract. It includes an unenhanced scan followed by scanning the kidneys in the corticomedullary, nephrographic, and EPs after rapid bolus injection of contrast (100–120 mL of 300 mgI/mL of contrast) at the rate of 3–4 mL/sec.45 Use of dense oral contrast medium is not recommended for renal CT as the contrast in the bowel may obscure small ureteral stones making their detection difficult. The dense oral contrast medium poses a major problem in 3D-CT angiography and to avoid major overlay in the postprocessed images,46 it is recommended that negative oral contrast medium/water should be administered. And 500–750 mL of water can be given over a 15–20-minute period before the start of a renal CT examination.47

Fig. 12: Contrast-enhanced axial scans showing the kidneys as smooth and oval structures with an anteromedial break in the region of hilum where the vascular pedicle enters. The longer left renal vein is seen crossing anterior to the aorta and posterior to the superior mesenteric artery to enter the inferior vena cava at the level of the uncinate process of the pancreas.
Noncontrast
This phase is useful for baseline density measurements of renal masses and diagnosis of areas of hemorrhage/renal hematoma.48 Areas of renal parenchymal calcification, fat attenuation, and calcification in a renal mass can all be detected on the noncontrast scan. These are also helpful to differentiate a renal solid mass from hyperdense cyst. Noncontrast CT is regarded as the primary imaging modality to detect urinary tract calculi.49 The American Association and Endourological Society Guidelines for the Surgical Management of stones specifically recommend that clinicians should obtain a noncontrast CT before performing percutaneous nephrolithotomy (PCNL) in adults and children.50 Low-dose computed tomography (LDCT) and ultralow-dose computed tomography (ULDCT) have been proposed to reduce radiation risks for the detection of urolithiasis.51,5216

Figs. 13A to D: Axial CT sections showing the normal anatomy of the urinary structures from superior to inferior: (A) The renal pelvis; (B) Upper ureters; (C) Mid ureters; (D) Distal ureters.
Normal CT Nephrogram
The first phase is the corticomedullary phase (CMP) and it is seen 25–80 seconds following contrast administration. In this phase, the lumen of the proximal tubules fills up with contrast which then enters the cortical capillaries and peritubular capillary spaces. In this phase, the renal cortex is distinctly differentiated from the unenhanced medulla (Fig. 14).53 The nephrographic phase (NP) is the second phase and begins 90–120 seconds after contrast injection. The contrast passes through the renal tubules during this phase. In the nephrogram phase, there is a homogeneous enhancement of the renal parenchyma with loss of the corticomedullary differentiation (Fig. 15). The excretory phase (EP) begins with the excretion of the contrast material into the collecting system and is seen best 3–5 minutes after contrast administration (Fig. 16).

Fig. 14: Contrast-enhanced CT scan of the kidney in the corticomedullary phase showing dense cortical enhancement, the renal cortex is distinctly differentiated from the unenhanced medulla in this phase.
Corticomedullary Phase
This phase is important for the evaluation of tumor hypervascularity and differentiation of normal variants and pseudotumors from renal masses. This phase is also the best phase for the diagnosis of tumor extension in the renal vein as maximum opacification of the renal vein and arteries occur during this time (Figs. 17A and B).17

Fig. 15: Contrast-enhanced CT of the kidney in the nephrogram phase showing dense homogeneous parenchymal enhancement. The corticomedullary differentiation disappears during this phase.
However, scanning the kidney only in the CMP may lead to errors as hypervascular cortical renal cell carcinomas (RCCs) may enhance to the same degree as the normal cortex and thus may be obscured. Also, small hypovascular tumors of the renal medulla may not enhance sufficiently and may be missed.54 It is therefore essential to scan the kidney in the NP following the CMP.
Nephrographic Phase
Nephrographic phase is considered as the optimum phase for not only detection but also characterization of renal masses. In this phase, there is a homogeneous enhancement of both the cortex and medulla. This phase is useful particularly for the lesions <;3 cm.55 Any enhancement>20 HU is considered suggestive of malignancy and this lesion enhancement is usually best visualized on the NP.56 Renal infarction, traumatic parenchymal lesions, and acute pyelonephritis is also best visualized on the NP as the lesions stand out as hypodense areas against the enhanced renal parenchyma (Figs. 18A and B).

Excretory Phase
This provides a good delineation and visualization of the pelvicalyceal system.

Figs. 17A and B: (A) Noncontrast axial CT showing a large hypodense mass replacing the left kidney. (B) The corticomedullary phase shows multiple tortuous feeder vessels depicting tumor hypervascularity. Thrombus is also seen in inferior vena cava in the case of Wilms’ tumor, the corticomedullary phase being excellent for the depiction.

Figs. 18A and B: (A) Nephrogram phase showing a wedge-shaped area of hypoattenuation against the enhanced right renal parenchyma suggestive of renal infarct; (B) Image in another case showing complete lack of nephrogram suggesting devascularization of the right renal parenchyma in a case of trauma. The normal nephrogram with homogeneous enhancement of the renal parenchyma is seen on the left side.
The excretory phase (EP) images are useful for evaluation of urothelial lesions including urothelial neoplasms, calyceal deformities, papillary necrosis, and strictures and inflammatory changes of the collecting system and ureters.57
Pathological CT Nephrogram
Renal infarctions, blunt renal trauma, and acute pyelonephritis account for a pathological nephrogram. These conditions result in impaired renal perfusion with a focal reduction of the nephrogram. A segmental/total lack of the nephrogram is seen in cases of blunt renal trauma owing to devascularization. In acute pyelonephritis, inflammatory obstruction results in reduced tubule transit rate. The delayed perfusion of the renal tubule system is seen as a “striated nephrogram” pattern.58 Conditions like acute ureteric obstruction, acute obstruction of the renal vein, and significant stenosis of the main renal artery result in reduced density and slowed temporal progression of the three phases of the nephrogram. Conditions like shock/severe systemic hypotension result in a bilaterally reduced density and persistence of nephrogram due to a reduced GFR and tubular stasis.
MDCT in Renal Masses
A multiphasic MDCT is necessary for optimal evaluation of renal masses.59 Noncontrast CT is used to detect calcifications and the precontrast attenuation value allows quantification of enhancement on the postcontrast scans. The CMP best shows the extension of the tumoral tissue into the renal vein and IVC which is important for staging. A hypodense, filling defect within the renal vein which is usually dilated is suggestive of a thrombus. Heterogeneous enhancement of the thrombus with evidence of neovascularity favors a tumor thrombus over a bland thrombus. The neovascularity, arterial feeders, and the entire arterial anatomy is best seen on the CMP. Accurate demonstration of the arterial anatomy is essential to plan a nephron sparing surgery. The NP is the most useful for characterization of indeterminate masses. An enhancement value>20 HU is considered highly suggestive of a RCC as these are hypervascular and enhance on the postcontrast scans.60 The EP is useful for demonstrating the relationship of a centrally located mass with the pelvicalyceal system. Involvement of the renal pelvis and calyces can also be best seen on the EP. Transitional cell carcinomas (TCCs) are also best detected during this phase as subtle hypodense filling defects within the renal pelvis, calyces or the ureters. A washout>15 HU seen in a mass on the EP is also highly suggestive of a RCC as these show a significant washout as well (Figs. 19A to C).61 A hyperdense renal cyst, on the contrary, will show no change in density between the corticomedullary and the excretory/delayed images.61
Three-dimensional CT (3DCT) along with CT angiography is useful to define the tumor and its relationship to the renal surface, the pelvicalyceal system and the adjacent organs. Viewing in multiple planes and orientations can be done to obtain all the information needed to plan a surgical resection. A display of the arterial and venous anatomy is possible prior to surgery.19

Figs. 19A to C: (A) Noncontrast; and (B and C) contrast-enhanced axial scans showing a large heterogeneous mass in the right kidney with enhancement>20 HU and washout>15 HU suggestive of a malignant renal mass. Areas of necrosis are also noted.
MDCT in Urolithiasis and Acute Flank Pain
A noncontrast CT of the abdomen is the most sensitive and specific test for the detection of urinary tract calculi. A 98% sensitivity and 100% specificity for their detection has been reported by Fielding et al.62 Noncontrast thin collimation scans (3–5 mm) are obtained from the upper pole of the kidneys to the pubic symphysis for the detection of urolithiasis which may be a cause of hematuria as well. Irrespective of the calcium content, almost all calculi are seen as radiopaque densities on noncontrast CT. Identification of a stone within the ureter is the most specific diagnostic finding of urolithiasis. A “rim sign” may also be seen in cases of calculi owing to the ureteral wall edema that develops at the site of impaction.63 This is seen as an area of soft tissue thickening (1–2 mm thickness) around the calculus. A decreased density of the renal parenchyma, hydronephrosis, hydroureter, and perinephric stranding are the other features seen in cases of calculi. A decreased attenuation of the renal parenchyma on the obstructed side by 5–14 HU is considered an objective finding of obstruction (Figs. 20A to C).64 CT can also differentiate calculi from phleboliths. Calculi have a dense center while phleboliths have a central lucency. A “comet tail sign” which is a linear or curvilinear soft tissue density extending from an abdominal/pelvic calcification is highly suggestive of a phlebolith.65 MDCT is also useful for detecting the cause of pain other than stone such as appendicitis, biliary colic, diverticulitis, etc.66
MDCT in Blunt Renal Trauma
In patients with trauma, a noncontrast scan followed by multiphasic scanning needs to be done. The CMP is the best phase to show injuries of the renal arteries including internal injuries which are nonocclusive in nature. Renal vein thrombosis can also be seen. Contrast extravasations which occur during the CMP are due to hemorrhage as compared to contrast extravasations that occur during the EP which are due to rupture of the pelvicalyceal system (Figs. 21A to C). Contained hemorrhage or pseudoaneurysm is seen as a well-defined lesion within the area of laceration. Active hemorrhage is seen as ill-defined or flame-shaped area with bright enhancement close to an artery.67 NP is the best to demonstrate areas of renal infarction/nonperfused parenchymal injuries. EP images are the best to show contrast extravasation in urinomas indicating an injury to the collecting system.68
MDCT in Renal Infections
Multidetector computed tomography is a more useful modality than IVU or ultrasound in the assessment of renal infection. The nature and extent of the disease process as well as complications such as gas forming infections, abscess formation, and urinary obstruction can all be well seen on CT.69 The most characteristic finding of acute pyelonephritis is poorly defined low attenuating areas of decreased attenuation which are wedge-shaped radiating from the medulla to the cortical surface. These wedge-shaped areas are best seen in the NP. A nephrogram pattern consisting of alternating linear bands of hyper- and hypoattenuation, the so called “striated nephrogram” is another characteristic finding of acute pyelonephritis. Other findings include focal or diffuse enlargement of the kidney, diminished concentration of contrast in the tubules due to the inflammatory process, stranding of the perinephric fat, thickening of Gerota's fascia, and obliteration of renal sinus.70 A focal thinning of the cortex may result from scarring in chronic cases.20

Figs. 20A to C: Noncontrast axial scans (A and B) of the abdomen showing a left ureteric calculus with soft tissue edema around, i.e. the rim sign (A) and the left hydronephrosis (B). The hydronephrotic left kidney has a lower attenuation than the normal right kidney. Curved multiplanar reformation displaying the left ureteric calculus, the consequent hydronephrosis, and the entire dilated left ureter proximal to it regardless of opacification (C).

Figs. 21A to C: (A) Nephrogram phase image showing laceration of the right renal parenchyma with perinephric hematoma; (B) Sagittal multiplanar reformation image showing fracture of the kidney; (C) Excretory phase showing extravasation of contrast in the perinephric hematoma suggesting rupture of the pelvicalyceal system.
Image Processing and Postprocessing Techniques on Computed Tomography
The various 3D visualization techniques in the evaluation of the urinary tract are MPR, maximum intensity projection (MIP), shaded surface display (SSD), and volume-rendered techniques (VRTs).
Multiplanar Reformation
Multiplanar reformation (MPR) represents a simple reordering of the image voxel. For MPR, the structures must be in the same plane, hence it cannot be generated for structures not in the same plane. Pseudostenoses are created as structures course in and out of the MPR. Curved multiplanar reformations (CPRs) are useful to overcome this problem.71 CPR images can be obtained by drawing a line over the structure of interest, it can also be produced by a dedicated software automatically or semiautomatically. CPR is useful in the demonstration of vessels of small diameter or structures with tortuous anatomy like the ureters (Figs. 22A to C).72 The limitation, however, is the dependence on accuracy of the curve generated.
Maximum Intensity Projection
Maximum intensity projection (MIP) displays the maximum voxel intensity along a line in a given volume. Structures with high density such as the contrast opacified collecting system and vessels are well demonstrated on MIP images. Angiograms and urograms are examples where this technique is used (Figs. 23A to C). However, the major limitation is obscuration of the area of interest by high density material like bone, calcium, and oral contrast medium. MIP also lacks depth orientation.7321

Figs. 22A to C: (A) Coronal multiplanar reformation (MPR) image showing a left ureteric calculus and the dilated pelvicalyceal proximal to it; (B and C) Curved multiplanar images show the left ureter in its entirety.

Figs. 23A to C: Maximum intensity projection (MIP) in the excretory phase demonstrating the normally opacified calyces, the ureters, and the bladder. This technique displays the maximum voxel value along a line of viewer and projection through a given volume and a rotational viewing of multiple projections can be done (A to C).
Shaded Surface Display
Shaded surface display (SSD) enables an accurate 3D representation of anatomy. It relies on the gray scale to yield surface reflections of structures. Though it provides a depth orientation, its major limitation lies in the dependence on user selected threshold setting.
Volume Rendered Technique
Volume rendered technique takes the entire volume of data and displays anatomic structures with different levels of opacity/attenuation. All attenuation values within a voxel are used to obtain the final image with each voxel contributing color, brightness, and opacity to the final image. The renal parenchyma, renal vasculature, and the pelvicalyceal system have different levels of opacity and can be seen simultaneously using this technique. VRT is an excellent 3D technique that provides a roadmap to the surgeon and produces images with72 which the clinicians are familiar with. By editing out bone and other areas that overlie the area of interest excellent 3D images can be generated in the desired orientation (Figs. 24A and B).
MULTIDETECTOR CT UROGRAPHY
It is an examination of the urinary tract in the EP following intravenous contrast on MDCT. CT urography can examine the entire genitourinary tract in a single study. It is a comprehensive examination that allows evaluation of both the renal parenchyma and the urothelium. Multidetector computed tomography urography (MDCTU) can be used as a “one-stop imaging test” for the entire urinary tract.7422

Figs. 24A and B: Volume-rendering technique displaying the entire urinary tract. This technique takes the entire volume of data and displays anatomic structures with different levels of opacity/attenuation.
The two approaches to perform a CT urography include:
- CT hybrid urography
- CT—only CT urography.
CT HYBRID UROGRAPHY
This technique combines CT and IVU into a single comprehensive examination. No CT postprocessing is necessary as images are obtained in a coronal reformatted form familiar to the clinicians. CT hybrid urography may entail imaging the patient in two different locations. Conventional urography images can be acquired in an IVU room followed by transferring the patient to the CT room and imaging the patient without an additional dose of contrast medium.75 However, the disadvantages involved in moving the patient from one place to another involve longer time, additional resources, and inadequate opacification of the pelvicalyceal system during acquisition because of the time elapsed in moving the patient.76 In some centers, this problem has been solved by installing a ceiling mounted X-ray tube above the CT table and a special tabletop that allows insertion of a screen film system beneath the patient.77 With this technique, an abdominal radiograph, a noncontrast CT followed by a multiphasic CT followed by overhead excretory urography and postvoid films can be acquired. However, by the use of CT scanned projection radiography (CTSPR) which is also known as topogram or scannogram, the technique can be performed on any MDCT scanner.78 CTSPR images do not require a ceiling mounted X-ray tube. In this, a combination of axial CT scans and enhanced CTSPR images are obtained. The spatial resolution of CTSPR, however, is inferior to that of conventional radiographs.
CT—Only CT Urography
This involves acquisition of unenhanced and enhanced CT scans of the abdomen and pelvis including the EP. Caoili and associated performed a four phase CT urogram comprising an unenhanced scan, NP and two EPs, one at 5 minutes and the other at 7.5 minutes.79 However, a four phase protocol consisting of two EPs (at 5 minutes and 7.5 minutes) is usually not recommended because of radiation issues. A three phase protocol is usually followed in most institutions consisting of the unenhanced phase, a NP and an EP.80 The NP is acquired at 90–100 sec following contrast administration (100–150 mL of 300 mg/mL iodine concentration at the rate of 2–4 mL/sec). The excretory/pyelographic phase is usually taken 12–15 minutes following contrast administration to evaluate the urothelium from the pelvicalyceal system to the bladder.
Techniques to Improve Urinary Tract Distension
- Diuretic administration: A diuretic like 10 mg of furosemide given 1 minute before contrast administration has been reported to increase ureteric distension. It also allows for a less dense homogeneous opacification of the collecting system.81
- Compression: External compression is not a part of MDCTU protocol because it causes patient discomfort and has not been shown to improve the percentage of visualized segments.83
- Patient positioning: A MDCTU performed in the prone position achieves a higher opacification of mid and distal ureters than supine position. However, being cumbersome, it is not advocated for routine use. Scanning is done in the supine position for computed tomography urography (CTU).84
- Image interpretation: MPR, MIP, and VRT images are most commonly used.85 The reformats show the urinary tract in entirety and are useful for characterization of renal masses, presence of calculi, evaluation of ureter, and localization of the exact level of abnormality.
Split Bolus MDCT Urography with Synchronous NP and EP Enhancement
A split bolus technique has been proposed by Chow and colleagues to minimize radiation dose as well as minimize the number of images generated.86 This is a two-phase technique in which an unenhanced series of images is followed by the “nephropyelographic phase”, that is, there is a simultaneous acquisition of the nephrographic and pyelographic phases. In this technique, following the noncontrast scan, 30 cc of nonionic contrast is infused intravenously which is the first bolus. The patient is then removed from the CT table and allowed to walk around for 10 minutes. 10–15 minutes later a contrast-enhanced CT is performed following a second bolus of contrast injection. 100 cc of nonionic contrast is injected intravenously and scanning is done after a delay of 100 seconds. By allowing the contrast bolus to be split, 30 cc (1st bolus) followed by 100 cc (2nd bolus), the nephrographic and pyelographic phases can be acquired simultaneously. In this single nephropyelographic phase, both the renal parenchyma (NP) and the collecting system (pyelographic phase) can be assessed.
Triple Bolus CT Urography
In this, the bolus is split into three and then a combined corticomedullary, nephrographic, and EP is acquired.87 The first bolus is 30 mL given at 2 mL/sec used for the opacification of the excretory system followed 7 minutes later by the second bolus of 50 mL at 1.5 mL/sec for the renal parenchyma and finally a third bolus 20 seconds later of 65 mL at 3 mL/sec for arterial information. The three phases are then acquired in a single scan, obtained some 510 seconds after start of first bolus. A triple bolus technique further reduces radiation dose as compared to the split bolus.87,88
Indications for CT urography are as follows:
- Hematuria
- Urothelial lesions
- Calculi
- Renal tumors
- Ureteral lesions
- Pelviureteric junction obstruction
- Congenital anomalies.
Hematuria
Computed tomography urography (CTU) has an overall sensitivity of 92.4–100% and specificity of 89–97.4% in detection of the causes of hematuria.89,90 CTU can be justified as a first line test in hematuria patients with a high probability for TCCs.91 For the lower risk patients, CTU is a problem-solving modality if the work-up remains negative and hematuria persists.92
The algorithm for the evaluation of painless microscopic/macroscopic hematuria is given in Table 5.91
| ||||||||||||||||||||
Urothelial Lesions
Computed tomography urogram is excellent in the depiction of urothelial lesions with a high sensitivity and specificity. CTU is superior not only to IVU but also to retrograde ureterography, an imaging technique considered superior to IVU in the evaluation of the pelvicalyceal system and ureters.93 MDCTU is an accurate technique for detection and staging of TCCs of the upper urinary tract. The TCC occurs most commonly in elderly men and risk factors include chemical carcinogens, smoking, cyclophosphamide or phenacetin use. The entire urinary tract is susceptible to malignant transformation owing to the field effect of these carcinogens. As a result, TCCs are often multifocal at presentation and the entire urinary tract should be screened even if a single lesion is detected (Figs. 25A to D). MDCTU is the imaging modality that provides a screening of the entire urinary tract for synchronous and metachronous lesions in TCC.94 Synchronous lesions are discrete TCC foci identified on a single study while metachronous lesions are those detected on follow-up imaging. MDCTU is the first line imaging modality when noninvasive imaging is needed for the detection and surveillance of urothelial lesions of the upper urinary tract.95
Calculi
Computed tomography urogram has an advantage over intravenous urogram (IVU) in detecting extraurinary pathologies that may mimic calculi (Figs. 26A and B).96 It is more accurate than intravenous urogram in detecting presence, size, and location of the calculi, can detect calculi in unusual positions such as in a calyceal diverticulum. Like intravenous urogram, CT urogram provides physiological information about the function of kidneys. A delayed excretion of contrast which is an index of obstruction, hydronephrosis, and hydroureter can all be well seen on the CT urogram images.

Figs. 25A to D: (A to C) Contrast-enhanced axial and (D) coronal images on CT scan showing a grossly hydronephrotic right kidney with small polypoidal masses within. Note is made of diffuse circumferential thickening of the right ureter at the ureterovesical junction—multifocal transitional cell carcinoma.

Figs. 26A and B: (A) CT urogram using maximum intensity projection technique depicting a calculus at the pelviureteric junction on the right side and a calculus in the proximal left ureter. There are back pressure changes on both sides; (B) Volume-rendering technique image displaying the same.

Figs. 27A to C: (A) Contrast-enhanced axial; and (B) coronal images showing a heterogeneous mass in the upper pole of right kidney; (C) CT urogram using maximum intensity projection technique (MIP) showing distortion and amputation of the infundibula of the calyces suggestive of a malignant mass—right renal cell carcinoma.
Renal Tumors
A precise depiction of the tumor and its relation to the collecting system is required in cases of nephron-sparing surgery. CT urogram delineates not only the collecting system, shows distortion splaying, and amputation of the calyces in RCCs but also the renal, perirenal, and the vascular tissues (Figs. 27A to C).97
Ureteric Lesions
Computed tomography urography has a role in the depiction of traumatic and iatrogenic ureteral injury. MDCTU scores over intravenous urogram in differentiating extrinsic from intrinsic causes of ureteric obstruction.98 CTU can show benign ureteric strictures, short segment malignant strictures, mural thickening, retroperitoneal masses, lymphadenopathy, retroperitoneal fibrosis, and iatrogenic causes of ureteric strictures. An infiltration of the ureter due to malignant pelvic masses is also well seen on MDCTU (Fig. 28).99
Pelviureteric Junction Obstruction
Visualization of crossing vessels along with narrowing of ureter in the same sets of images helps in establishing the etiology and diagnosis of PUJ obstruction.100
Congenital Anomalies
In a duplicated system, CT urogram shows both the functioning and nonfunctioning components in contrast to intravenous urogram which shows only the functioning moiety. It shows the entire course of both upper and lower 26moiety along with the ectopic opening of the upper moiety which is often hydronephrotic.101 Crossed fused renal ectopia, horseshoe kidney, and renal ectopia are all well seen on CTU (Figs. 29A to C). In cases of retrocaval ureter, CT urogram shows not only the ureteric compression but also the cause of the compression which is the IVC.
Radiation Dose of CT Urography
There are differing amounts of radiation exposure according to the different techniques used. While a radiation dose of 23.4 mSv is attributed to three phasic CTU, a triple bolus CTU involves lower dose of radiation about 13.2 mSv.87 Overall a split bolus or a triple bolus technique reduces the radiation dose by 15–45% compared to a three phasic study.102 Where dual energy computed tomography (DECT) is available, further reduction of radiation dose can be achieved by acquiring virtual nonenhanced scan from DECT and omitting unenhanced scan.103 In several studies with CTU protocol using iterative reconstruction further reductions in radiation dosage to the tune of 6.1 mSv have been achieved.104,105
DUAL ENERGY CT IN THE UPPER URINARY TRACT
Acquisition of high and low energy datasets can be achieved by either a dual source dual energy scanner or a single source dual energy scanner with rapid alteration of high and low kilovoltage settings, that is, a dual energy scanner with fast kilovoltage switching, with acquisition usually at 80 kVp and 140 kVp. Two types of images are obtained on DECT which are as follows:
- Material density images which provide material specific information.
- Monochromatic images which provide energy selective information.
The commonly selected DECT basis material pairs are: (1) Iodine and water; (2) Iodine and calcium. Iodine has a high atomic number while water has a low atomic number. When iodine is paired with water, two sets of images are produced. One set is that of iodine density images and the other of water density. Voxels that show an attenuation similar to that of iodine attenuation are removed from the water density images and represented on the iodine density images. Virtual unenhanced images are produced which provide the same information as a noncontrast scan.

Fig. 28: Curved multiplanar reformation image depicting infiltration of left ureter via cervical mass and consequent proximal hydroureteronephrosis. Delayed opacification of the pelvicalyceal system is seen on the left as compared to the normal well-opacified pelvicalyceal system and ureter on the right side.

Figs. 29A to C: (A) Contrast-enhanced axial scans revealing a low lying ectopic kidney with fusion of renal parenchyma of both the kidneys; (B) volume-rendered image in the excretory phase depicting the fused low lying ectopic kidney; (C) Volume-rendered image with the bone edited out revealing the same—ectopic pancake kidney.
27The iodine density images give information about the degree of enhancement which can even be quantified by placing a region of interest (ROI) over the lesion. Color- coded overlay images can also be generated.106 A color can be assigned to the voxels containing the selected material and the voxels can be superimposed on the monochromatic images.
Characterization of Renal Masses on Dual Energy CT
Enhancement is an important criterion for differentiating hyperattenuating renal cysts from solid masses. The attenuation measurements of the two may be quite similar on the contrast-enhanced CT images. On iodine density images, voxels containing iodine appear bright and renal masses appear brighter than proteinaceous cysts on these images. The iodine density can be measured in absolute quantitative terms (milligrams/milliliter) and the degree of enhancement in renal masses can be quantified. The water density images can be used as virtual unenhanced images and can be used to detect calcifications/hemorrhage within a renal mass.107 Also, in cases where surgery cannot be undertaken and thermal ablation is done for renal masses a follow-up can be done by DECT since it involves a single phase of scanning and limits the radiation dose received by the patient.
Characterization of Renal Stones by Dual Energy CT
The different types of calculi cannot be differentiated when scanned at a single energy level owing to a similar attenuation. DECT helps in differentiating uric acid from nonuric acid calculi.108 Calcium and uric acid density images can be generated depicting the respective calculi. A plot of effective atomic numbers versus monochromatic image-based attenuation values can distinguish the various types of calculi (calcium, struvite, uric acid, and cystine).109 This differentiation is important because of the different lines of management, for example, uric acid calculi are amenable to oral medications, struvite can be managed by extracorporeal shock wave lithotripsy (ESWL) while the cysteine ones are resistant to fragmentation with lithotripsy.
Dual Energy CT in CT Urography
All CT urography protocols include an unenhanced scan to detect calculi followed by contrast-enhanced scans.110 The generation of virtual unenhanced images on DECT urography can obviate the need for an unenhanced scan and hence reduce radiation dosages.
CT ANGIOGRAM OF RENAL ARTERIES
Indications of CT angiogram of the renal arteries include:111
- Evaluation of renal artery stenosis (RAS).
- Preoperative assessment of the number and course of renal arteries in renal donors.
- Assessment of renal vessels crossing the PUJ prior to repair of obstruction. It is important to know about a crossing vessel because the postsurgical outcome of endopyelotomy is worse in patients with a crossing vessel than those without it.
- Evaluation of renal artery involvement in abdominal aortic aneurysms.
- Detection of renal artery aneurysms.
Technique
The renal arteries have a small diameter and have a parallel or near parallel course to the imaging plane. Hence, nominal section thickness of 1.25 mm and overlapping reconstructions are necessary. A bolus injection of 150 mL of contrast material (300 mg Iodine/mL) with a flow rate of 4 mL/sec produces good opacification of the renal arteries. The ROI for the scan volume is determined by the initial topogram/axial scans. Conventionally, the region between the SMA and lower border of L3 is chosen. This allows the sites of origin of accessory renal arteries to be included. Delay time is determined through prior time density curves of dynamic scanning and patient is instructed to hold breath at time of acquisition. A real-time bolus tracking/care bolus technique can be adopted where acquisition is triggered with the arrival of contrast in the aorta.
Maximum intensity projection (MIP) and volume rendering (VRT) display modes are most commonly used (Fig. 30).112

Fig. 30: CT angiogram using volume-rendering technique depicting the normal renal arteries on both sides.

Figs. 31A to C: CT angiogram maximum intensity projection images (A and B) showing stenosis of the right renal artery with the left renal artery being normal in caliber. Volume-rendered image (C) showing narrowing of the abdominal aorta with stenosis of the right renal artery—involvement of the right renal artery in a case of aortoarteritis.
Depth, surface, and relative X-ray attenuation are all conveyed with VRT. The structures adjacent to the vessels can be displayed and the 3D dataset can be modified in any orientation to optimize depiction of the renal vascular anatomy (Figs. 31A to C). MIP images provide useful information about atherosclerotic burden, vascular stenosis, and vascular stents, and are used in conjunction with VRT. Perspective rendering can also be used to produce angioscopic views which are helpful in identifying a vascular orifice and stenosis.
The sensitivity of computed tomography angiogram (CTA) for determination and location of main renal artery approaches 100%.113 Arterial branches can be identified accurately till the segmental level.114 Limitation for detection occurs with vessels smaller than 2 mm in size. It is not only the arterial anatomy but renal venous anatomy is also well documented on CTA. The renal venous anatomy is important to document for patients undergoing laparoscopic donor nephrectomy. Tributaries into the left renal vein, especially the posterior lumbar branches, are well displayed on the CTA. If enlarged, this is of potential surgical importance.
MAGNETIC RESONANCE IMAGING OF THE UPPER URINARY TRACT
A growing need for radiation dose reduction combined with advances in MRI has led to the increasing use of MRI for assessment of the urinary tract in recent times. While contrast resolution is a major advantage of MRI over other imaging modalities, the limited temporal and spatial resolution coupled with poor sensitivity for detecting calcifications has impeded this modality to emerge as the single most important modality for evaluation of the urogenital tract.115 However, the advent of 3 Tesla MRI has changed the scenario. And 3 Tesla MRI provides a significant improvement in signal-to-noise ratio (SNR) which can in turn be used to obtain higher spatial resolution or faster imaging, i.e. imaging times can be reduced while maintaining acceptable SNR. A two-fold increase in SNR can be achieved by 3 Tesla MRI but a major drawback is the increase in magnetic susceptibility artefacts. MRI is the preferred modality:116,117
- For determining the cephalic extent of an intracaval tumor in a case of RCC when the superior extent cannot be determined by CT.
- Characterization of small renal masses that are indeterminate on CT or US.
- Differentiation between hemorrhagic renal cysts and renal masses by use of subtraction imaging. In this, a nonenhanced T1 weighted image is subtracted from a contrast-enhanced T1 weighted sequence which cancels the native T1 sequence and leaves behind only the enhancing portion. Thus, subtraction images are useful in identifying true enhancement in complex renal cysts.
- Evaluation of renal donors.
- In screening patients with inherited conditions such as Von Hippel–Lindau disease which is characterized by renal cysts, angiomas, and RCC.
Technique
Patient Positioning
The patient lies supine with arms raised above the head. Phased array body coils are used. A phased array coil increases SNR, allows faster acquisitions minimizing breathing motion artefacts.118
Breath Holding
The motion of the kidneys during respiration leads to degradation of image quality. Hence, fast imaging techniques with rapid sequences are needed which can be acquired in a single breath hold. The preferred motion phase for breath holding is expiration as the kidney position is more constant and more reproducible in this phase. Before scanning the kidneys, it is important to ask the patient to hold his breath. The use of faster sequences such as single shot imaging, half Fourier technique helps to reduce motion artefacts. In addition, a saturation band can be placed over the subcutaneous fat of the anterior abdominal wall to reduce respiratory artefacts. Parallel imaging techniques such as sensitivity encoding and array spatial sensitivity encoding technique can also be used to reduce the acquisition time.119 Parallel imaging not only reduces the image blurring inherent to very long echo train spin echo sequences but also lowers the specific absorption rate (SAR). A respiratory gating to limit the data acquisition to end expiration or to a particular fixed point of the respiratory cycle can be done to reduce motion artefacts. A navigator which records diaphragmatic motion can also be used to obtain motion correction.
Sequences
Usually both T1- and T2-weighted images are acquired in the axial, coronal, and sagittal planes. Due to shorter acquisition times, T2 fast spin echo (FSE) imaging has almost replaced the conventional spin echo (CSE) T2-imaging. High resolution good quality T2-weighted images can be obtained in a short time using FSE sequences. Also, in and opposed phase breath hold T1-weighted gradient echo sequences provide a good anatomic detail and is useful for detection of intralesional fat, e.g. in AML. Imaging of the kidneys can be done in the corticomedullary, nephrographic, and EPs following contrast administration, similar to that on MDCT. Gradient echo fast low angle shot (FLASH) sequence can be used to obtain postcontrast images. Differentiation between solid masses and complicated cystic lesions can be achieved on comparison between pre- and postcontrast images obtained in corticomedullary and NPs.120 Delayed postcontrast images depict tumor extension in the perinephric fat and venous structures.
Gadolinium-based contrast agents (GBCAs), however, should be used with caution in patients with renal insufficiency because of risk of development of NSF .121 Nephronic systemic fibrosis is an acquired idiopathic systemic disorder characterized by indurated plaques and papules most commonly of the extremities and trunks. Besides skin changes, NSF also results in fibrosis of other organs such as myocardium, skeletal muscles, lungs, kidneys, and testes. The condition is potentially fatal and hence gadolinium should not be administered in severe renal insufficiency (GFR <; 30 mL/min).122
Normal Appearance of the Upper Urinary Tract on MRI
Magnetic resonance (MR) allows visualization of the corticomedullary differentiation on both T1- and T2- weighted images. This differentiation is best visualized on T1 weighted MR images where the cortex has a higher signal intensity than the adjacent medulla (Figs. 32A and B). The cortex has less water than the medulla and has a longer T1-time and hence is brighter than medulla on a T1-weighted image.123 On T2-weighted images, the cortex appears hypointense to the medulla (Figs. 33A and B). The renal sinus fat shows a high signal on both T1 and T2 weighted images. The renal capsule is seen as a hypointense line while the perirenal and pararenal fat shows a bright signal on all pulse sequences.124 The pelvicalyceal system is not seen in a nondistended state. When distended with urine, the collecting system shows a low signal on T1- and bright on T2-weighted images. The renal arteries, veins, aorta, and IVC are seen as flow voids. Like a contrast-enhanced CT, the corticomedullary differentiation is most accentuated (CMP) at 20–80 seconds following contrast. At around 90–120 seconds, there is loss of this differentiation with both cortex and medulla-enhancing intensely (NP). This is followed by contrast appearing in the calyces in approximately 180 seconds (EP) (Figs. 34A to C).12530
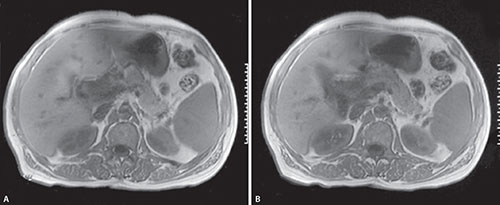
Figs. 32A and B: Axial T1W MR images showing the normal corticomedullary differentiation of the kidneys. The cortex appears brighter than the medulla on T1W image. The pararenal fat also has a bright signal.

Figs. 33A and B: Axial T2W MR images showing the medulla to be brighter than the renal cortex. The renal sinus is also bright due to fat while the pararenal fat also shows a bright signal.

Figs. 34A to C: Postcontrast dynamic axial scans showing (A) the normal corticomedullary phase where the cortex can be distinctly differentiated from the medulla; (B) the nephrogram where there is a homogeneous opacification of the renal parenchyma; and (C) the excretory phase where there is appearance of the contrast into the pelvicalyceal system.
MAGNETIC RESONANCE UROGRAPHY
Magnetic resonance urography (MRU) allows a complete evaluation of the urinary tract. It can be performed with a static fluid or an excretory technique.126
Static Fluid MR Urography
In this, no contrast is administered. This technique exploits the long T2-relaxation time of urine. Heavily T2-weighted sequences are used to generate high signal intensity images from static fluid in the collecting system.127 The low signal intensity images of the background tissue are suppressed. Heavily T2-weighted sequences such as rapid acquisition with relaxation enhancement (RARE) and half Fourier acquisition single shot turbo spin echo (HASTE) are very fast and can be acquired in a single breath-hold. The fat in the background is suppressed. 3D respiratory triggered sequences can also be used to obtain volume rendering (VR) and MIP images. For the evaluation of urinary tract peristalsis and narrowing, stenosis or stricture, multiple images obtained can be played as a cine loop. Static fluid MRU can evaluate the urinary tract course and diameter, even when the kidneys are poorly excreting or it is an obstructed system.
Excretory MR Urogram
Excretory MR urogram is performed using a T1-weighted gadolinium-enhanced 3D gradient echo fat suppression sequence like 3D FLASH. A standard dose of gadolinium (0.1 mmol/kg) is administered intravenously. Diuretic administration (0.1 mg/kg of furosemide) enhances the urine flow and gives a better dilution and uniform distribution of the contrast agent (Figs. 35A to C).128 Oral hydration and furosemide administration improve the distension of the ureters and the collecting system. Distension of the upper urinary tracts can be improved by a full urinary bladder, provided the patient can tolerate such an approach. In order to reduce the bowel-related susceptibility effects which are a problem in the region of distal ureters and bladder dome, it is preferable to have patients fast before the examination.
Images are typically acquired in the coronal plane with a field of view that includes the kidneys, ureters, and bladder. As with intravenous urogram, oblique images or multiplanar reconstructions of the collecting system can be undertaken for a better delineation of the anatomy. Excretory MR urography is better at demonstrating a communication between the renal collecting system and a fluid collection than the static MR technique. Since this technique requires excretion of contrast into the collecting system, it is better at delineating nonobstructed ureters and does not have much role in obstructed or poorly excreting kidneys.129 Excretory MRU is not recommended in patients with severe renal insufficiency due to the risk of NSF and also because the kidneys will not be able to excrete the contrast material.130
Clinical Applications of MR Urography
- Magnetic resonance urogram is useful in delineating the level of urinary tract obstruction. About 90% of ureteral stones can be detected by gadolinium-enhanced 3D gradient echo excretory MR urography combined with T2-weighted sequences. Persistent dilatation of the ureters above a filling defect and high signal intensity perinephric edema on T2- weighted images constitute the signs of acute calculus obstruction.
- Magnetic resonance urography has a role in the detection of urothelial carcinomas. Intravenous GBCAs help in delineating the extent of tumor.131
- Extrinsic compressions of the ureters such as in prostate or uterine carcinomas or in retroperitoneal fibrosis can be depicted on MRU.
- Magnetic resonance urography can assess the various congenital urinary tract anomalies accurately such as duplex systems, PUJ obstruction, and insertion of an ectopic ureter.132
- Functional data can also be obtained from excretory MRU including renal transit time, differential renal function, and estimated GFR.133
- Magnetic resonance urography is useful in the evaluation of potential renal transplant donors and in the assessment of urologic complications following renal transplantation as it avoids the use of potentially nephrotoxic-iodinated contrast material of CT urogram.

Limitations of MR Urograms
- Lower spatial resolution as compared to CT
- Long imaging time
- Motion sensitivity
- Lower sensitivity in detection of calcification as compared to CT.
Magnetic resonance urography is indicated in patients who cannot receive iodinated contrast material or where exposure to ionizing radiation is undesirable. Owing to these limitations of MRU, CT urography still continues to be the test of choice for evaluation of patients with hematuria though MR urography is commonly indicated in children and pregnant patients with a dilated collecting system.134 In pregnant patients, physiological dilatations of the ureter can be distinguished from obstructive uropathy. Static fluid MRI is quick and easy to perform, does not use contrast medium and hence is well tolerated even in advanced stages of pregnancy.
MAGNETIC RESONANCE ANGIOGRAM
Magnetic resonance angiogram (MRA) can be performed without the use of contrast by techniques such as gradient time of flight (TOF), TRUFISP or the phase contrast (PC).135 These techniques render the flowing blood bright. However, there are several limitations such as overestimation of stenosis due to turbulent jets leading to signal loss, fresh thrombus giving a bright signal, motion artefacts, nonvisualization of small vessels, and slow flow resulting in poor quality images. Hence, contrast-enhanced MRA (CEMRA) is the preferred technique as it is free of flow-related phenomenon, has high spatial resolution, and assesses the true lumen of vessels.136 Both the arterial and venous vasculature can be well visualized on the CEMRA images. An ultrafast 3D T1 gradient echo sequence like FLASH is used to obtain thin slices which are reconstructed as MIP to yield angiographic images (Fig. 36).

Fig. 36: MR angiogram image showing the normal renal arteries on both sides. An accessory renal artery is seen on the right side.
FUNCTIONAL MRI OF THE KIDNEYS
The primary role of the kidney is to maintain homeostatic balance by filtering out metabolites and minerals from the blood and excreting them along with water in the urine. The most commonly used measure of renal function is serum creatinine. This is, however, a late marker of renal dysfunction, it is often deranged late in the course of the disease and at times when irreversible damage to the kidneys has taken place. Functional impairment occurs much before the anatomic manifestations such as atrophy in cases of renal failure and hence an early detection of functional loss allows for an early institution of therapy to halt the progression.137 The various techniques for functional imaging include the following as described here.
Contrast-enhanced MR Renography138
Dynamic contrast-enhanced MR of the kidneys is called MR renography. This technique measures the transit of contrast material, usually a gadolinium chelate, through 33the renal cortex, the renal medulla, and the collecting system. The technique involves acquiring images before, during, and after administration of the contrast material, converting the signal intensity of the renal tissues to gadolinium concentration and plotting of the time signal intensity curves.139 As these gadolinium-contrast agents pass through capillaries and renal tubules, they cause the signal intensity of the renal tissues to increase. By analyzing the enhancement of the renal tissues as a function of time parameters such as renal blood flow, medullary blood volume GFR can be determined. Perfusion maps can then be generated.
Clinical applications of the MR renography:140
- Renovascular hypertension: Angiotensin-converting enzyme (ACE) inhibitor injection is helpful in differentiating hemodynamically significant stenosis from insignificant stenosis. Those with a significant stenosis have a decrease in GFR following administration of ACE inhibitor while no change in GFR values is noted in those with insignificant stenosis.
- Allograft dysfunction: The major complication in renal transplanted kidneys is ATN which is an ischemic injury to renal tubules. While acute rejection shows a reduced cortical and medullary perfusion, ATN shows a maintained perfusion. Thus, MR perfusion maps generated can help differentiate between these conditions obviating the need for an invasive renal biopsy.
- Functional urinary obstruction: The renal transit time which is defined as the time between tracer appearance in the kidney and in the ureter can be used to differentiate between normal and obstructed kidneys.141
Diffusion Weighted MRI
Diffusion weighted imaging (DWI) which measures the Brownian motion of water molecules in tissues has been historically used for stroke imaging. However, with improvements in hardware and software including parallel imaging, it is being used for abdominal applications. DWI is used for the detection and characterization of focal renal lesions as benign or malignant, in the assessment of nuclear grade and renal cancer subtype as well as in the assessment of malignant lymph nodes from urogenital tumors. It is also being used to assess treatment response in patients with renal cell cancer undergoing targeted chemotherapy. DWI is also being used in the evaluation of renal function. Single shot echoplanar imaging is the sequence most commonly used for DWI. Quantification of diffusion can be done by apparent diffusion coefficient (ADC) values. DWI has a role in:142
- Renal insufficiency: It has been seen in various studies that patient with acute and chronic renal failure showed lower ADC values in both the cortex and medulla of their kidneys as compared to normal healthy kidneys. DWI also provides split function information unlike the blood parameters which do not provide information about the function of each kidney separately though conditions like RAS and ureteric obstruction are usually unilateral. Studies have also shown that hydronephrotic kidney with impaired renal function has lower ADC values as compared to obstructed kidneys with normal function. DWI thus has a potential role in the evaluation of renal dysfunction.
- Renal allograft: DWI has a role in the evaluation of renal allografts. A decrease in cortical ADC value is attributed to allograft dysfunction.
- Renal artery stenosis: Patients with significant RAS had lower values of ADC, thus opening the possibility of it being diagnosed without the use of contrast-enhanced MR angiography.
Diffusion Tensor Imaging
The renal medulla is composed of radially oriented compactly arranged renal tubules. Fractional anisotropy (FA) can provide structural and flow information. The role of diffusion tensor imaging in renal imaging is under investigation.143
Blood Oxygen Level Dependent MRI
Blood oxygen level dependent (BOLD) imaging is a technique to noninvasively measure renal oxygenation. It utilizes the paramagnetic effects of deoxyhemoglobin to obtain images sensitive to local oxygen concentration. A multiple gradient recalled echo (GRE) sequence is the most widely used sequence for BOLD MRI. Deoxyhemoglobin induces a magnetic susceptibility effect that disturbs the local magnetic field and increases the spin–spin relaxation time (R2*) of surrounding water. A high R2* value corresponds to low tissue oxygenation.144
Applications of BOLD
- Diabetic nephropathy: A significant increase in oxygenation of renal medulla has been found in normal healthy kidney in response to water diuresis, while this response is absent in diabetic patients.
- Renal transplant: BOLD imaging can help differentiate cases of acute rejection from ATN.
Arterial Spin Labeling: Noncontrast Perfusion Imaging
It is a method of performing perfusion studies without the use of exogenous contrast. Arterial spin labeling (ASL) uses magnetically labeled protons in arteries and is noninvasive. The main applications are assessment of response to antiangiogenic drugs in renal tumor, differentiation between renal tumors and measurement of renal function, and perfusion in CKD.
23Na MRI
This is a promising noninvasive method for physiologic imaging of the human kidneys. The technique allows quantification of 23Na concentration of the cortex and medulla and evaluates the changes which occur under different physiologic conditions.145
MR Elastography
In recent years, there is a great interest in the study of tissue stiffness of the kidneys for many disease processes affecting the kidneys. It has been seen in some studies that the stiffness of the renal parenchyma is lower in a diseased kidney as compared to the normal kidneys.146 Magnetic resonance elastography (MRE) of the kidneys is challenging and holds promise in the evaluation of chronic renal disease and renal allografts.
CONCLUSION
A clear understanding of the anatomy and physiology of the urogenital system is essential for a better understanding of the disease processes. The advanced visualization techniques do not create data over and above the cross- sections, but using the tools to display data in new ways that simulate 3D anatomy creates additional visual information about the patient. An attempt should be made by every radiologist to reach an accurate diagnosis thereby improving patient care and justifying the additional effort and expense.
REFERENCES
- Nino-Murcia M, de Vries PA, Friedland GW. Congenital anomalies of the kidney. In: Pollack HM, McClennan BL (Eds). Clinical Urography. Philadelphia: Saunders; 2000. pp. 690–763.
- Satyapal KS, Haffejee AA, Singh B, et al. Additional renal arteries incidence and morphometry. Surg Radiol Anat. 2001;23(1):33–8.
- Bhatt S, Dogra VS. Kidney. In: Haaga JR, Boll DT (Eds). CT and MRI of the whole body, 6th edition. Philadelphia, PA: Elsevier; 2016. pp. 1781–861.
- Kabala JE. The urogenital tract: Anatomy and investigations. In: Sutton D (Ed). Textbook of radiology and imaging, 7th edition. London: Churchill Livingstone; 2003. pp. 885–928.
- Gore RM, Balfe DM, Aizenstein RI, et al. The great escape: interfascial decompression planes of the retroperitoneum. AJR Am J Roentgenol. 2000;175(2):363–70.
- Kabala J. Attempting to increase the sensitivity of the plain film for ureteric calculi. Use of the full bladder. Br J Radiol. 1991;64(768):1151–3.
- Levine JA, Neitlich J, Verga M, et al. Ureteral calculi in patients with flank pain: correlation of plain radiography with unenhanced helical CT. Radiology. 1997;204(1):27–31.
- Dyer RB, Chen MY, Zagoria RJ. Intravenous urography: technique and interpretation. Radiographics. 2001;21(4):799–824.
- Katzberg RW. Urography into the 21st century: new contrast media, renal handling, imaging characteristics and nephrotoxicity. Radiology. 1997;204(2):297–312.
- Stacul F. Current iodinated contrast media. Eur Radiol. 2001;11(4):690–7.
- Katayama H, Yamaguchi K, Kozuka T, et al. Adverse reactions to ionic and nonionic contrast media: a report from the Japanese Committee on the Safety of Contrast Media. Radiology. 1990;175(3):621–8.
- Dalla Palma L. What is left of i.v. urography? Eur Radiol. 2001;11(6):931–9.
- Kohli A. Has the time come to write the EPITAPH for the intravenous urogram? Ind J Radiol Imaging. 2005;15(2):161–4.
- Shine S. Urinary calculus: IVU vs CT renal stone? A critically appraised topic. Abdom Imaging. 2008;33(1):41–3.
- Warshauer DM, McCarthy SM, Street L, et al. Detection of renal masses: sensitivities and specificities of excretory urography/linear tomography, US, and CT. Radiology. 1988;169(2):363–5.
- Wells ITP, Raju VM, Rowberry BK, et al. Digital tomosynthesis: a new lease of life for the intravenous urogram. Br J Radiol. 2011;84(1001):464–8.
- Caoili EM, Cohan RH, Inampudi P, et al. MDCT urography of upper tract urothelial neoplasms. Am J Roentgenol. 2005; 184(6):1873–81.
- Taylor RJ, Bennett AH, Schwentker FN, et al. Use and abuse of retrograde pyelography. Urology. 1979;14(5):536–9.
- Paul A. The normal kidney. In: Meire HB, Cosgrove D, Dewbury KC, Tarrant P (Eds). Abdominal and General Ultrasound. Edinburgh: Churchill Livingstone; 2001. pp. 515–27.
- Greenfield SP, Williot P, Kaplan D. Gross hematuria in children: a ten-year review. Urology. 2007;69(1):166–9.
- Hulton SA. Evaluation of urinary tract calculi in children. Arch Dis Child. 2001;84(4):320–3.
- Grossfeld GD, Litwin MS, Wolf JS, et al. Evaluation of asymptomatic microscopic hematuria in adults: the American Urological Association Best Practice Policy. Part I: definition, detection, prevalence and etiology. Urology. 2001:57(4):599–603.
- Thurston W, Wilson R. The Urinary Tract. In: Rumack CM, Wilson SR, Charboneau JW (Eds). Diagnostic Ultrasound, 5th edition, Maryland Heights: Elseiver Mosby; 2017. pp. 321–93.
- Purohit K, Purohit A, Satpathy G. Measurement of normal kidney length by sonography and its relation to age, sex and body habitus. IJAR. 2017;5(4.3):4668–73.
- Emamian SA, Nielsen MB, Pedersen JF, et al. Kidney dimensions at sonography: correlation with age, sex and habitus in 665 adult volunteers. Am J Roentgenol. 1993;160(1):83–6.
- Marchal G, Verbeken E, Oyen R, et al. Ultrasound of the normal kidney: a sonographic, anatomic and histologic correlation. Ultrasound in Med and Biol. 1986;12:999–1009.
- Rosenfield AT, Taylor KJ, Dembner AG, et al. Ultrasound of renal sinus: new observations. Am J Roentgenol. 1979;133(3):441–8.
- Hricak H, Slovis TL, Callen CW, et al. Neonatal kidneys: sonographic anatomic correlation. Radiology. 1983;147(3):699–702.
- Swischuk LE. Genitourinary Tract and Adrenal Glands. In: Imaging of the Newborn, Infant and Young Child, 5th edition. Philadelphia: Lippincott Williams & Wilkins; 2004. pp. 590–724.
- Han BK, Babcock DS. Sonographic measurements and appearance of normal kidneys in children. Am J Roentgenol. 1985;145:611–6.
- Lafortune M, Constantin A, Breton G, et al. Sonography of the hypertrophied column of Bertin. Am J Roentgenol. 1986;146:53–6.
- Carter AR, Horgan JG, Jennings TA, et al. The junctional parenchymal defect: a sonographic variant of renal anatomy. Radiology. 1985;154:499–502.
- Hoffer FA, Hanabergh AM, Teele RL. The interrenicular junction: a mimic of renal scarring on normal pediatric sonograms. Am J Roentgenol. 1985;145(5):1075–8.
- Fine H, Keen EN. The arteries of the human kidney. J Anat. 1966;100:881–94.
- Dubbins PA. The kidney. In: Allan PL, Dubbins PA, Pozniak M, Mc Dicken WN (Eds). Clinical Doppler Ultrasound. London: Churchill Livingstone; 2000. pp. 169–90.
- Chang EH. An introduction to contrast-enhanced ultrasound for nephrologists. Nephron. 2018;138(3):176–85.
- Seguel AP, Perez MM, Gonzalez TR, et al. Evaluation of upper tract urothelial carcinomas by contrast-enhanced ultrasound. Radiologia. 2018;60(6):496–503.
- Chang EH, Chong WK, Kasoji SK, et al. Diagnostic accuracy of contrast-enhanced ultrasound for characterization of kidney lesions in patients with and without chronic disease. BMC Nephrol. 2017;18(1):266.
- Leong SS, Wong JHD, Md Shah MN, et al. Shear wave elastography in the evaluation of renal parenchymal stiffness in patients with chronic kidney disease. Br J Radiol. 2018;91(1089):20180235.
- Schreyer H, Uggowitzer M, Ruppert Kohlmayr A. Helical CT of the urinary organs. Eur Radiol. 2002;12:575–91.
- Foley WD. Special focus session. Multidetector CT: Abdominal visceral imaging. Radiographics. 2002;22(3):701–19.
- Wolin EA, Hartman DS, Olson JR. Nephrographic and pyelographic analysis of CT urography: principles, patterns and pathophysiology. Am J Roentgenol. 2013;200(6):1210–14.
- Kocakoc E, Bhatt S, Dogra VS. Renal multidetector row CT. Radiol Clin N Am. 2005;43:1021–47.
- Yuh BI, Cohan RH. Different phases of renal enhancement: role in detecting and characterizing renal masses during helical CT. Am J Roentgenol. 1999;173(3):747–55.
- Wintersperger BJ, Nikolaou K, Becker CR. Multidetector row CT angiography of the aorta and visceral arteries. Semin Ultrasound CT MR. 2004;25:25–40.
- Sheth S, Fishman EK. Multidetector row CT of the kidneys and urinary tract: techniques and applications in the diagnosis of benign diseases. Radiographics. 2004;24(2):e20.
- Tunaci A, Yekeler E. Multidetector row CT of the kidneys. Eur J Radiol. 2004;52:56–66.
- Villa L, Giusti G, Knoll T, et al. Imaging for urinary stones: update in 2015. Eur Urol Focus. 2016;2(2):122–9.
- Assimos D, Krambeck A, Miller NL, et al. Surgical management of stones: American Urological Association/Endourological Society Guideline. Part I. J Urol. 2016;196(4):1153–60.
- Lukasiewicz A, Bhargavan Chatfield M, Coombs L, et al. Radiation dose index of renal colic protocol CT studies in the United States: a report from the American College of Radiology: National Radiology Data Registry. Radiology. 2014;27(12):445–51.
- Kluner C, Hein PA, Gralla O, et al. Does ultra-low dose CT with a radiation dose equivalent to that of KUB suffice to detect renal and ureteral calculi? J Comput Assist Tomogr. 2006;30(1):44–50.
- Saunders HS, Dyer RB, Shifrin RY, et al. The CT nephrogram: implications for evaluation of urinary tract disease. Radiographics. 1995;15(5):1069–85.
- Szolar DH, Kammerhuber F, Altziebler S, et al. Multiphasic helical CT of the kidney: increased conspicuity for detection and characterization of small (<3 cm) renal masses. Radiology. 1997;202(1):211–7.
- Urban BA. The small renal mass: What is the role of multiphasic helical scanning? Radiology. 1997;202(1):22–3.
- Hilton S, Jones LP. Recent advances in imaging cancer of the kidney and urinary tract. Surg Oncol Clin N Am. 2014;23:863–910.
- Cowan NC, Turney BW, Taylor NJ, et al. Multidetector computed tomography urography for diagnosing upper urinary tract urothelial tumour. BJU Int. 2007;99(6):1363–70.
- Kawashima A, LeRoy AJ. Radiologic evaluation of patients with renal infections. Inf Dis Clin North Am. 2003;17:433–56.
- Sheth S, Scatarige JC, Horton KM, et al. Current concepts in the diagnosis and management of renal cell carcinoma: Role of multidetector CT and three-dimensional CT. Radiographics. 2001;21:S237–54.
- Zagoria RJ. Imaging of small renal masses: A medical success story. AJR Am J Roentgenol. 2000;175(4):945–55.
- Macari M, Bosniak MA. Delayed CT to evaluate renal masses incidentally discovered at contrast-enhanced CT: demonstration of vascularity with de-enhancement. Radiology. 1999;213:674–80.
- Fielding JR, Steele G, Fox LA, et al. Spiral computerized tomography in the evaluation of acute flank pain: a replacement for excretory urography. J Urol. 1997;157:2071–3.
- Heneghan JP, Dalrymple NC, Verga M, et al. Soft tissue “rim” sign in the diagnosis of ureteral calculi with use of unenhanced helical CT. Radiology. 1997;202:709–11.
- Georgiades CS, Moore CJ, Smith DP. Differences of renal parenchymal attenuation for acutely obstructed and unobstructed kidneys on unenhanced helical CT: a useful secondary sign. Am J Roentgenol. 2001;176:965–8.
- Bell TV, Fenlon HM, Davison BD, et al. Unenhanced helical CT criteria to differentiate distal ureteral calculi from pelvic phleboliths. Radiology. 1998;207(2):363–7.
- Willmann JK, Roos JE, Platz A, et al. Multidetector CT: Detection of active hemorrhage in patients with blunt abdominal trauma. Am J Roentgenol. 2002;179:437–44.
- McNicholas MM, Raptopoulos VD, Schwartz RK, et al. Excretory phase CT urography for opacification of the urinary collecting system. Am J Roentgenol. 1998;170:1261–7.
- Kundra V, Silverman PM. Impact of multislice CT on imaging of acute abdominal disease. Radiol Clin North Am. 2003;41(6):1083–93.
- Kawashima A, Sandler CM, Goldman SM, et al. CT of renal inflammatory disease. Radiographics. 1997;17:851–66.
- Rubin GD. 3-D imaging with MDCT. Eur J Radiol. 2003;45(Suppl 1):S37–41.
- Lockhart ME, Smith JK. Technical considerations in renal CT. Radiol Clin North Am. 2003;41:863–75.
- Rydberg J, Buckwalter KA, Caldemeyer KS, et al. Multisection CT: Scanning techniques and clinical applications. Radiographics. 2000;20:1787–806.
- Dillman JR, Caoili EM, Cohan RH. Multidetector CT urography: a one stop renal and urinary tract imaging modality. Abdom Imaging. 2007;32(4):519–29.
- Herts BR. The current status of CT Urography. Crit Rev Comput Tomogr. 2002;43(3):219–41.
- Vrtiska TJ, King BF, LeRoy AJ, et al. CT urography: analysis of techniques and comparison with IVU (abstr). Radiology. 2000;217(P):225.
- McCollough CH, Daly TR, King Jr BF, et al. An auxiliary CT table top for radiography at the time of CT. J Comput Assist Tomogr. 2001;25(6):876–80.
- Kawashima A, Vrtiska TJ, LeRoy AJ. CT scanned projection radiographs (SPR) utilizing enhanced algorithms: applications in CT urography (abstr). Radiology. 2002;225(P):690.
- Caoili EM, Cohan RH, Korobkin M, et al. Urinary tract abnormalities: Initial experience with multidetector row CT urography. Radiology. 2002;222(2):353–60.
- Kawashima A, Vrtiska TJ, LeRoy AJ, et al. CT urography. Radiographics. 2004;24:S35–54.
- Sanyal R, Deshmukh A, Sheorain VS, et al. CT urography: a comparison of strategies for upper urinary tract opacification. Eur Radiol. 2007;17(5):1262–6.
- Silverman SG, Akbar SA, Mortele KJ, et al. Multidetector-row CT urography: comparison of furosemide and saline as adjuncts to contrast medium for depicting the normal urinary collecting system. Radiology. 2006;240:749–55.
- Caoili EM, Inampudi P, Cohan RH, et al. Optimization of multidetector row CT urography: effect of compression, saline administration and prolongation of acquisition delay. Radiology. 2005;235:116–23.
- McTavish JD, Jinzaki M, Zou KH, et al. Multidetector row CT urography: Comparison of strategies for depicting the normal urinary collecting system. Radiology. 2002;225:783–90.
- Jinzaki M, McTavish JD, Zou KH, et al. Evaluation of small (≤3 cm) renal masses with MDCT: benefits of thin overlapping reconstructions. Am J Roentgenol. 2004;183(1):223–8.
- Chow LC, Kwan SW, Olcott EW, et al. Split bolus MDCT urography with synchronous nephrographic and excretory phase enhancement. Am J Roentgenol. 2007;189:314–22.
- Kekelidze M, Dwarkasing RS, Dijkshoorn ML, et al. Kidney and urinary tract imaging: triple bolus multidetector CT urography as a one stop shop: protocol design, opacification, and image quality analysis. Radiology. 2010;255(2):508–16.
- Abedi G, Okhunov Z, Lall C, et al. Comparison of radiation dose from conventional and triple bolus computed tomography urography protocols in the diagnosis and management of patients with renal cortical neoplasms. Urology. 2014;84(4):875–80.
- Lang EK, Thomas R, Davis R, et al. Multiphasic helical computerized tomography for the assessment of microscopic hematuria: a prospective study. J Urol. 2004;171(1):237–43.
- Albani JM, Ciaschini MW, Streem SB, et al. The role of computerized tomographic urography in the initial evaluation of hematuria. J Urol. 2007;177(2):644–8.
- Van Der Molen AJ, Cowan NC, Mueller-Lisse UG, et al. CT Urography Working Group of the European Society of Urogenital Radiology (ESUR). CT urography: definition, indications and techniques. A guideline for clinical practice. Eur Radiol. 2008;18(1):4–17.
- Khadra MH, Pickard RS, Charlton M, et al. A prospective analysis of 1930 patients with hematuria to evaluate current diagnostic practice. J Urol. 2000;163(2):524–7.
- Raman SP, Fishman EK. Upper and lower tract urothelial imaging using computed tomography urography. Urol Clin N Am. 2018;45:389–405.
- Vikram R, Sandler CM, Ng CS. Imaging and staging of transitional cell carcinoma: part 2. Upper urinary tract. Am J Roentgenol. 2009;192(6):1488–93.
- Chlapoutakis K, Theocharopoulos N, Yarmenitis S, et al. Performance of computed tomographic urography in diagnosis of upper urinary tract urothelial carcinoma, in patients presenting with hematuria: systematic review and meta-analysis. Eur J Radiol. 2010;73(2):334–8.
- Chai RY, Jhaveri K, Saini S, et al. Comprehensive evaluation of patients with haematuria on multi-slice computed tomography scanner: protocol design and preliminary observations. Australas Radiol. 2001;45:536–8.
- Joffe SA, Servaes S, Okon S, et al. Multidetector row CT urography in the evaluation of hematuria. Radiographics. 2003;23(6):1441–55.
- Potenta SE, D'Agostino R, Sternberg KM, et al. CT Urography for Evaluation of the Ureter. Radiographics. 2015;35:709–26.
- Patel RC, Newman RC. Ureteroscopic management of ureteral and ureteroenteral strictures. Urol Clin North Am. 2004;31(1):107–13.
- Lawler LP, Jarret TW, Corl FM, et al. Adult ureteropelvic junction obstruction: insights with three dimensional multidetector row CT. Radiographics. 2005;25(1):121–34.
- Berrocal T, López-Pereira P, Arjonilla A, et al. Anomalies of the distal ureter, bladder and urethra in children: embryologic, radiologic and pathologic features. Radiographics. 2002;22(5):1139–64.
- Lupescu IG, Marica OL. CT urography. How when why? Rev Rom Urol. 2012;11(4):17–20.
- Kaza RK, Platt JF, Cohan RH, et al. Dual-energy CT with single and dual source scanners: current applications in evaluating the genitourinary tract. Radiographics. 2012;32(2):353–69.
- Juri H, Matsuki M, Itou Y, et al. Initial experience with adaptive iterative dose reduction 3D to reduce radiation dose in computed tomographic urography. J Comput Assist Tomogr. 2013;37(1):52–7.
- Van der Molen AJ, Miclea RL, Geleijns J, et al. A survey of radiation doses in CT urography before and after implementation of iterative reconstruction. Am J Roentgenol. 2015;205(3):572–7.
- Kaza RK, Caoili EM, Cohan RH, et al. Distinguishing enhancing from nonenhancing renal lesions with fast kilovoltage switching dual energy CT. Am J Roentgenol. 2011;197(6):1375–81.
- Primak AN, Fletcher JG, Vrtiska TJ, et al. Noninvasive differentiation of uric acid versus non-uric acid kidney stones using dual-energy CT. Acad Radiol. 2007;14(12):1441–7.
- Eliahou R, Hidas G, Duvdevani M, et al. Determination of renal stone composition with dual-energy computed tomography: an emerging application. Semin Ultrasound CT MR. 2010;31(4):315–20.
- Takahashi N, Vrtiska TJ, Kawashima A, et al. Detectability of urinary stones on virtual nonenhanced images generated at pyelographic phase dual energy CT. Radiology. 2010;256(1):184–90.
- Kim TS, Chung JW, Park JH, et al. Renal artery evaluation: comparison of spiral CT angiography to intra-arterial DSA. J Vasc Inter Radiol. 1998;9:553–9.
- Napoli A, Fleischmann D, Chan FP, et al. Computed tomography angiography: state of the art imaging using multidetector row technology. J Comput Assist Tomogra. 2004;28:S32–45.
- Türkvatan A, Özdemir M, Cumhur T, et al. Multidetector CT angiography of renal vasculature: normal anatomy and variants. Eur Radiol. 2009;19:236–44.
- Yeh BM, Coakley FV, Meng MV, et al. Precaval right renal arteries: prevalence and morphologic associations at spiral CT. Radiology. 2004;230:429–33.
- Merkle EM, Dale BM, Paulson EK. Abdominal MR imaging at 3T. Magn Reson Imaging Clin N Am. 2006;14:17–26.
- Nikken JJ, Krestin GP. MRI of the kidney: State of the art. Eur Radiol. 2007;17:2780–93.
- Pedrosa I, Sun MR, Spencer M, et al. MR imaging of renal masses: correlation with findings at surgery and pathologic analysis. Radiographics. 2008;28:985–1003.
- Zhang J, Pedrosa I, Rofsky NM. MR techniques for renal imaging. Radiol Clin North Am. 2003;41:877–907.
- Glockner JF, Hu HH, Stanley DW, et al. Parallel MR imaging: a user's guide. Radiographics. 2005;25(5):1279–97.
- Israel GM, Bosniak MA. Pitfalls in renal mass evaluation and how to avoid them. Radiographics. 2008;28(5):1325–38.
- Schieda N, Krishna S, Davenport MS. Update on Gadolinium Based Contrast Agent-Enhanced Imaging in the Genitourinary System. Am J Roentgenol. 2019;212(6):1223–33.
- Perez-Rodriguez J, Lai S, Ehst BD, et al. Nephrogenic systemic fibrosis: incidence, associations and effect of risk factor assessment—report of 33 cases. Radiology. 2009;250(2):371–7.
- Bassignani MJ. Understanding and interpreting MRI of the genitourinary tract. Urol Clin N Am. 2006;33(3):301–17.
- Probert JL, Glew D, Gillatt DA. Magnetic resonance imaging in urology. BJU Int. 1999;83(3):201–14.
- Prasad SR, Dalrymple NC, Surabhi VR. Cross-sectional imaging evaluation of renal masses. Radiol Clin North Am. 2008;46(1):95–111.
- O'Connor OJ, McLaughlin P, Maher MM. MR urography. Am J Roentgenol. 2010;195(3):W201–6.
- Leyendecker JR, Gianini JW. Magnetic resonance urography. Abdom Imaging. 2009;34(4):527–40.
- Ergen FB, Hussain HK, Carlos RC, et al. 3D excretory MR urography: improved image quality with intravenous saline and diuretic administration. J Mag Reson Imaging. 2007;25(4):783–9.
- Silverman SG, Leyendecker JR, Amis Jr ES. What is the current role of CT urography and MR urography in the evaluation of the urinary tract? Radiology. 2009;250(2):309–23.
- Nolte-Ernsting CC, Staatz G, Tacke J, et al. MR urography today. Abdom Imaging. 2003;28(2):191–209.
- Takahashi N, Kawashima A, Glockner JF, et al. Small (<2 cm) upper tract urothelial carcinoma: evaluation with gadolinium enhanced three dimensional spoiled gradient recalled echo MR urography. Radiology. 2008;247(2):451–7.
- Dickerson EC, Dillman JR, Smith EA, et al. Pediatric MR urography: Indications, techniques and approach to review. Radiographics. 2015;35(4):1208–30.
- Jones RA, Perez-Brayfield MR, Kirsch AJ, et al. Renal transit time with MR urography in children. Radiology. 2004;233(1):41–50.
- Grattan-Smith JD, Little SB, Jones RA. MR urography evaluation of obstructive uropathy. Pediatr Radiol. 2008;38(Suppl 1):S49–69.
- Michaely HJ, Schoenberg SO, Rieger JR, et al. MR angiography in patients with renal disease. Magn Reson Imaging Clin N Am. 2005;13(1):131–51.
- Leiner T, Michaely H. Advances in contrast-enhanced MR angiography of the renal arteries. Magn Reson Imaging Clin N Am. 2008;16(4):561–72.
- Zhang JL. Functional magnetic resonance imaging of the kidneys—with and without gadolinium based contrast. Adv Chronic Kidney Dis. 2017;24(3):162–8.
- Zhang JL, Rusinek H, Chandarana H, et al. Functional MRI of the kidneys. J Magn Reson Imaging. 2013;37(2):282–93.
- Michaely HJ, Kramer H, Oesingmann N, et al. Intraindividual comparison of MR-renal perfusion imaging at 1.5 T and 3.0 T. Invest Radiol. 2007;42(6):406–11.
- Chu WC, Lam WW, Chan KW, et al. Dynamic gadolinium enhanced magnetic resonance urography for assessing drainage in dilated pelvicalyceal systems with moderate renal function: preliminary results and comparison with diuresis renography. BJU Int. 2004;93(6):830–4.
- Shokeir AA, El-Diasty T, Eassa W, et al. Diagnosis of ureteral obstruction in patients with compromised renal function: the role of noninvasive imaging modalities. J Urol. 2004;171:2303–6.
- Mürtz P, Krautmacher C, Träber F, et al. Diffusion-weighted whole body MR imaging with background body signal suppression: a feasibility study at 3.0 Tesla. Eur Radiol. 2007;17:3031–7.
- Notohamiprodjo M, Dietrich O, Horger W, et al. Diffusion tensor imaging (DTI) of the kidney at 3 Tesla–feasibility, protocol evaluation and comparison to 1.5 Tesla. Invest Radiol. 2010;45(5):245–54.
- Gloviczki ML, Glockner J, Gomez SI, et al. Comparison of 1.5 and 3T BOLD MR to study oxygenation of kidney cortex and medulla in human renovascular disease. Invest Radiol. 2009;44(9):566–71.
- Maril N, Rosen Y, Reynolds GH, et al. Sodium MRI of the human kidney at 3 Tesla. Magn Reson Med. 2006;56(6):1229–34.
- Bensamoun SF, Robert L, Leclerc GE, et al. Stiffness imaging of the kidney and adjacent abdominal tissues measured simultaneously using magnetic resonance elastography. Clin Imaging. 2011;35(4):284–7.