

Edward H Hon in USA created the electronic fetal monitoring (EFM), of which fetal heart rate (FHR) curve was recorded using an instantaneous heart rate meter, where the heart rate was measured by the interval of scalp lead fetal electrocardiographic (ECG) QRS peak triggers, and labor contraction was recorded by the amniotic pressure. He reported the first EFM machine in 1960, which recorded FHR curve and uterine contraction simultaneously by 3 cm/min chart, and fetal direct lead ECG with another high-speed recorder. The EFM recorded by fetal ECG and intrauterine pressure was widely spread in the world with Hon's classification of FHR deceleration patterns into early and late decelerations for periodic FHR variations, as well as into mild and severe variable decelerations, where the late decelerations and severe variable decelerations were the fetal distress.2 However, Hon described no lag time of late decelerations at visual diagnosis of delayed deceleration to the contraction, which was reported to be 20 or more sec in late decelerations later by L Chik et al.3 In the FHR baseline, the loss of irregularity was fetal distress in the FHR baseline.2 R Caldeyro-Barcia classified FHR decelerations into Typ I and Typ II.1 Hon and Caldeyro-Barcia negotiated to agree Type II dip was the same as late deceleration in 1968.
The cardiotocogram (CTG) was the external fetal monitoring of Konrad Hammacher, Germany in 1960s, which was composed of FHR recorder triggered by fetal heart sound detected by abdominal microphone, and external detection of labor contraction (tocodynamometry). Single triggering signal was obtained from I and II fetal heart tones using a special algorithm. He maybe intended to diagnose fetal well-being not only in the labor but also during pregnancy, that was unable by the EFM triggered by the fetal scalp lead QRS spikes and 2intrauterine amniotic pressure, although the fetal QRS trigger enabled to study short term FHR variability. Hammacher also used FHR pattern classification but particularly emphasized the FHR variability (Oszillation), which was classified into normal, excessively high (saltatorische) and the loss of variability (silente) that was diagnosed as fetal distress.4
THE FIRST PRODUCTION OF FETAL HEART RATE MONITOR IN JAPAN
The author designed a FHR and the contraction monitor in 1960s to trigger FHR curve by fetal heart sound, of which I and II tones were changed single trigger using a flip-flop multi-vibrator, or fetal scalp lead ECG. Uterine contraction was recorded by intrauterine pressure or external tocodynamometer with a guard-ring type transducer, which enabled to detect uterine contraction, and it has been utilized in external monitoring of labor contraction. The first fetal monitor in Japan and Asia, which enabled internal as well as external monitoring, was designed by the author, was provided by TOITU (Tokyo) in 1964, and firstly utilized in Kyushu University (Figure 1), then distributed in Japan and other cities. However, Japanese doctors did not prefer to the scalp clip electrode due to its invasive feature, preferring external technique of fetal heart beat detection, i.e. fetal heart sound microphone in early stage, then moved to ultrasonic Doppler method.


Figure 1: The first fetal monitor designed by the author and produced by TOITU (Tokyo), 1964. Fetal heart sound microphone or scalp lead fetal ECG-QRS were used to drive instantaneous fetal heart rate meter, where uterine contraction was recorded using intrauterine pressure or external tocodynamometry
The Japan Association of Maternal and Fetal Welfare (present Japan Association of Obstetricians and Gynecologists, JAOG) promoted the fetal monitoring in the members designing an external FHR monitor, which used fetal heart microphone and tocodynamometer in 1970s, and manufacturers produced the machine for the Association member, then the FHR monitoring was widely spread in Japan, and neonatal asphyxia decreased, perinatal deaths reduced and cerebral palsy decreased.5-7
DIAGNOSIS OF NONREASSURING FETAL STATES IN THE FHR MONITORING
Severe FHR changes appeared in CTG records before fetal demise in high risk cases, where FHR changes prior to fetal deaths were the loss of FHR variability, bradycardia, prolonged decelerations, severe late decelerations, severe variable decelerations or sinusoidal FHR, in 1970s (Figures 2 to 4). As fetal distress cases was considered to be severe hypoxia, Cesarean section (C-section) was performed afterwards when such FHR abnormalities appeared, then no fetal demise of unknown cause was experienced in our clinic. It was favorable results of fetal monitoring.
ULTRASONIC DOPPLER AUTOCORRELATION FETAL HEART RATE MONITOR

Figure 2: Nonreassuring fetal status (NRFS) (1) Intrapartum bradycardia in placental abruption before C-section; NRFS (2) Intrapartum late decelerations and loss of variability before severe neonatal asphyxia (1 min Apgar score = 3)
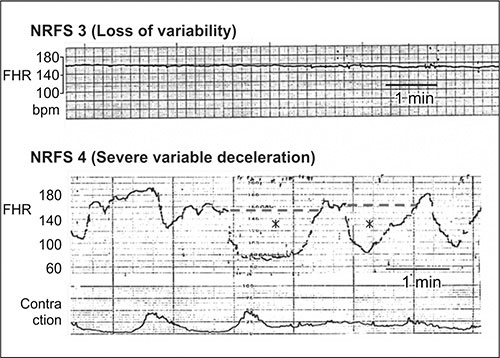
Figure 3: NRFS (3) Antenatal loss of variability before fetal demise; NRFS (4) Intrapartum severe variable decelerations, before neonatal asphyxia

Figure 4: NRFS (5) Antenatal prolonged deceleration before fetal demise; NRFS (6) Antenatal sinusoidal FHR before fetal demise
The author introduced ultrasonic Doppler fetal heart detector in Japan 1967, where fetal life was diagnosed in such early pregnancy as 7 gestational weeks,8 and in addition the fetal heart beat was very clearly detected in labor contractions, then the use of ultrasonic Doppler method was requested to monitor the fetus in the labor, while the safety of diagnostic ultrasound safety was unknown, therefore we investigated the safe use of ultrasound, and confirmed no suppression of cultured cell growth curve when the output ultrasound 5intensity was lower than 240 mW/cm2 in our experiments,9 then Japan Industrial Standard limited the output intensity of medical ultrasound below 10 mW/cm2,10 and the ultrasound Doppler autocorrelation FHR monitor was introduced, which highly improved the FHR curve tracing,11 thus, FHR monitor was changed to Doppler autocorrelation monitor, and external ultrasound FHR monitoring was widely spread in obstetrics as the main technique during pregnancy and in the labor.
QUANTITATIVE NRFS DIAGNOSIS BY FHR SCORE IN THE FHR MONITORING
The classification of FHR patterns in nonreassuring fetal status (NRFS) diagnosis was widely utilized in the EFM, however there was the difference of FHR pattern recognition among observers because the pattern recognition was subjective, then more objective diagnostic method was requested.
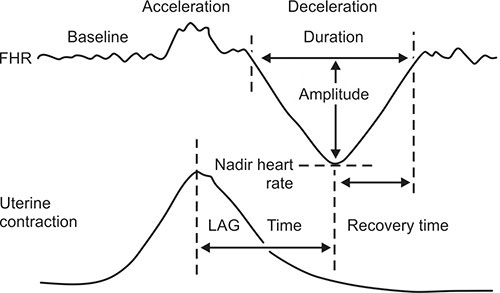
The author wished to exclude subjective pattern recognition from the fetal diagnosis by quantitative analysis of FHR changes (Figure 5) and to evaluate fetal condition with numeric FHR score determined by quantitative FHR curve analysis (Table 1).12
The largest FHR score obtained in the first stage of labor closely correlated neonatal Apgar score and umbilical arterial blood pH, in cases of noninterventional deliveries, i.e. neonatal Apgar score was 6 (mild neonatal asphyxia) and umbilical arterial blood pH was 7.3 when the FHR score was 10, and Apgar was 3 (severe asphyxia) and umbilical arterial blood pH was 7.0 (acidosis) when the first stage FHR score was 20. Further high FHR score resulted more severe neonatal asphyxia and acidosis. Thus a rapid artificial delivery could be indicated when the FHR score was high in early stage of labor and also in a high-risk pregnancy, C-section was indicated to prevent fetal demise when the FHR score was high, as comprehensive fetal state was shown by the FHR score (Table 2), where the 1 min Apgar score (Y) was correlated to FHR score in the first stage of labor (X) as follows:
6

and umbilical arterial pH (Z) was closely correlated the FHR score (X):

Neonatal states will be predicted from two regression equations (Table 2).
Since neonatal outcome will be unfavorable when severe asphyxia and definite acidosis are expected in the labor, rapid delivery will be indicated when the FHR score was higher than 10 in the first stage of labor.
|
The FHR score calculation is programmed for computer diagnosis.13,14 Detailed BASIC language program is published in a Japanese book entitled Actocardiogram.15 Computer systems are provided by TOITU (Tokyo).
The FHR score is an example of quantified FHR changes, it was followed by the artificial neural network analysis of FHR16-18 and frequency spectrum of FHR curve was analyzed for the diagnoses of sinusoidal heart rate.19
CONTROVERSIES IN THE CARDIOTOCOGRAM DIAGNOSIS
As the author pointed out, the cardiotocogram (CTG) diagnosis based on FHR pattern recognition was hard to be compared among observers, i.e. there was the difference in the pattern recognition among obstetricians, because the pattern classification was subjective. Although the disadvantage was overcome by quantitative FHR analysis and numeric FHR score, the developmental mechanism of such FHR changes as FHR acceleration, deceleration, bradycardia and variability were unknown in the EFM or CTG, e.g. in pattern diagnosis, mild variable deceleration was told to be nervous reflex to cord compression and severe variable deceleration was hypoxia, late decelerations were generally decided to be abnormal sign, developmental process of acceleration and bradycardia were unknown, and baseline variability was told to be the competition of sympathetic and vagal tones.
In the studies on heart rate (HR) and arterial blood PaO2 of hypoxic adult rabbits in nitrogen gas inhalation, the heart rate did not correlated to PaO2, if the PaO2 was higher than 50 mm Hg, while heart rate and PaO2 closely correlated when the PaO2 was lower than 50 mm Hg (Figures 6 and 7),20 and almost all of human umbilical arterial blood PaO2 was lower than 50 mm Hg,12 i.e. fetal bradycardia would be the sign of low PaO2 lower than 50 mm Hg, and therefore the bradycardia lower below 110 bpm was the sign of low PaO2 or hypoxia in CTG, where the deceleration or bradycardia developed by the excitation of parasympathetic center of medulla oblongata to hypoxia but did not directly indicate the fetal brain damage, because the hypoxic bradycardia caused by the excitation of the vagal center to hypoxia did not appear after the rabbit's urethane anesthesia.21 Awake parasympathetic center of the medulla oblongata is excited by the hypoxia, and the heart rate decrease is parallel to the lowering of PaO2 in adult rabbits (Figure 7). The same process will occur in lower PaO2 than 50 mm Hg of human fetus, i.e. fetal heart rate decreased showing bradycardia or deceleration by the hypoxia, and therefore it is high risk.8

Figure 6: The adult rabbit's heart rate did not change, if the PaO2 is higher than 50 mm Hg, while the heart rate decreased along with the reduction of PaO2, if the PaO2 was lower than 50 mm Hg, i.e. the heart rate expressed bradycardia if the PaO2 was lower than 50 mm Hg.19 That would be the reason of fetal bradycardia in fetal hypoxia, because umbilical arterial PaO2 was usually lower than 50 mm Hg12

Figure 7: The adult rabbit's heart rate (Y) closely correlates to the PaO2 (X), if the PaO2 was lower than 50 mm Hg; Y = 10.17X − 165.64, R2= 1.00, p<0.001. The regression equation is not applicable to human fetus, but the tendency can be applied, i.e. the FHR is parallel to the PaO2 because the umbilical arterial blood PaO2 is usually lower than 50 mm Hg in human,12 namely, fetal bradycardia will express the level of hypoxia
Repeated nadirs lower than 100 bpm lasting longer than 1 min are also risky due to repeated hypoxia in severe 9decelerations. Prolonged deceleration of low nadir longer than 2 min is also risky by the prolonged hypoxia, while shorter duration of nadir than 1 min above 100 bpm is not dangerous in mild and short hypoxia.
Developmental mechanism of physiologic sinusoidal FHR, FHR acceleration and long term FHR variability (LTV) could not be explained by the CTG, but they could be solved using actocardiogram, e.g. physiologic sinusoidal FHR was separated from true sinusoidal one when the periodically changing fetal respiration or fetal mouthing movements was associated the physiologic sinusoidal one in the actocardiogram,22 where the periodic fetal movements provoke moderate FHR variability, as discussed in later chapter.